

Bitcoin Price Holds Steady Amid Bullish Indicators
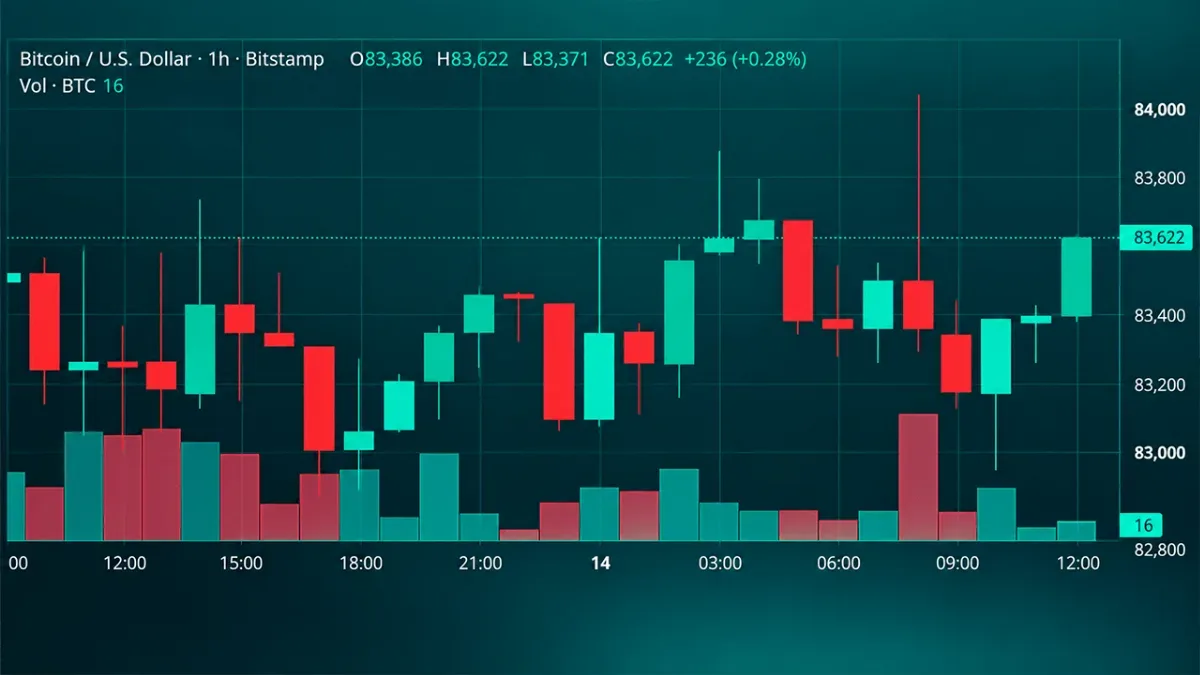
Bitcoin’s price fluctuated between $83,250 and $83,790 on October 14, 2026, showing limited movement over the preceding 24-hour period. While the price action has been contained, technical indicators suggest underlying strength.
Specifically, twelve out of fifteen moving average indicators are currently signaling bullish conditions. This indicates a generally positive trend in the medium to long term, despite the current price consolidation. The market’s technical foundation appears comparatively robust, even as the price struggles to break higher.
However, a resistance zone between $83,800 and $84,250 continues to cap upward momentum. Sustained buying pressure will be required to overcome this level and potentially trigger further gains. The relatively tight trading range suggests a period of indecision as the market assesses the next catalyst.
Traders are closely watching the interplay between the bullish moving averages and the overhead resistance. A decisive break above $84,250 could confirm the bullish outlook, while a drop below $83,250 might indicate a short-term reversal.
Market context
Market data reflects conditions at publication time and is not updated in real time.
Data captured at: Oct 14, 2026 15:55 (Tehran)
Likely market impact
| Segment | Outlook |
|---|---|
| Bitcoin | ● Neutral |
| Ethereum | ● Neutral |
| Altcoins | ● Neutral |
| Short term | ● Neutral |
| Long term | ▲ Positive |
Spot prices at publication
Fear & Greed Index
Chart
Source: Bitcoin.com News