

SHELL/USDT: Potential Bullish Continuation
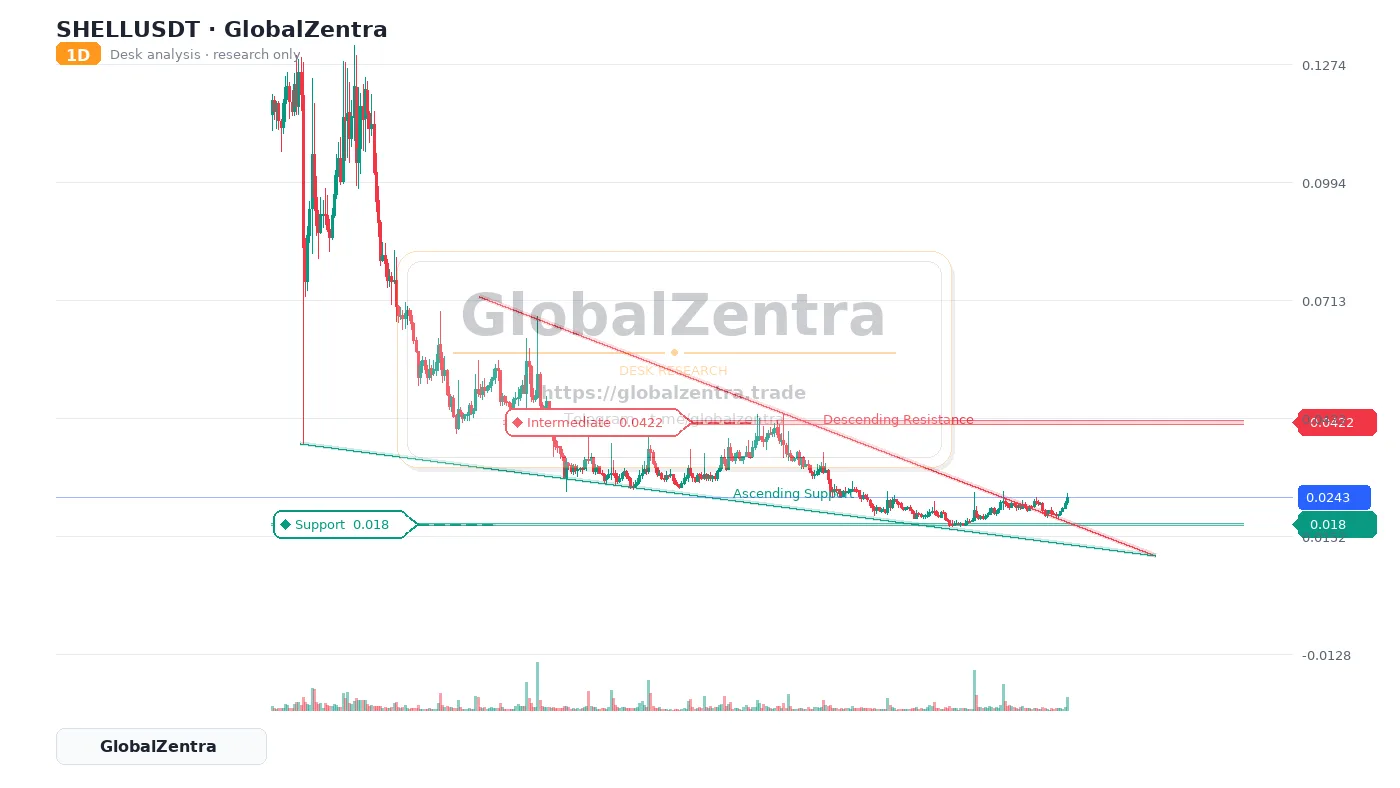
The daily chart for SHELL/USDT is currently displaying a bullish signal following a breakout from a descending triangle pattern. This pattern is characterized by a descending resistance line connecting highs at 0.45 to 0.02, and an ascending support line connecting lows at 0.055 to 0.02. The recent break above the descending resistance suggests a potential shift in momentum towards the upside.
Currently, resistance is identified within the 0.27776 – 0.28224 range. Should the price continue to climb, this zone will be a key area to watch. Conversely, support is established between 0.017856 and 0.018144, offering a potential floor for price action.
- Resistance Zone: 0.27776 – 0.28224
- Support Zone: 0.017856 – 0.018144
- Descending Resistance: Broken – previously 0.45 → 0.02
- Ascending Support: 0.055 → 0.02