

AVAXUSDT Breakout and Pullback: Is the Retest Complete?
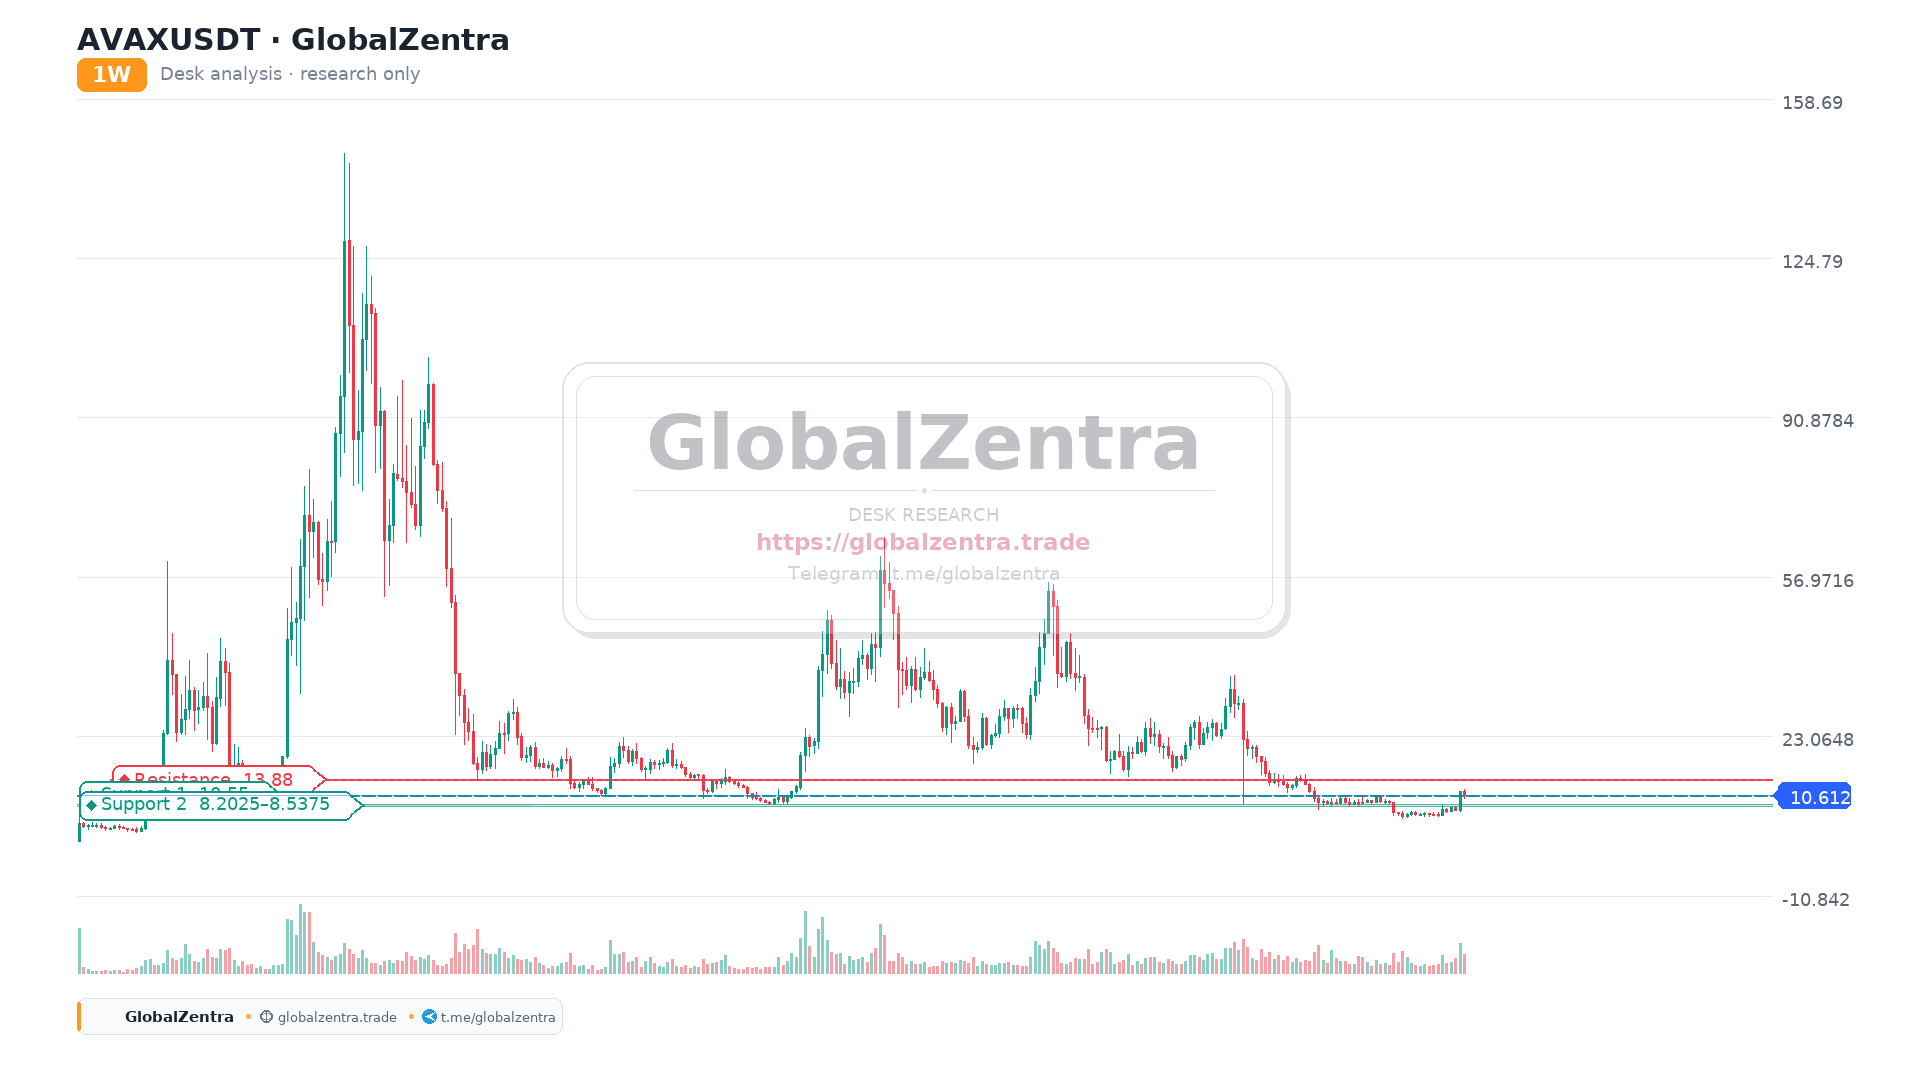
The AVAXUSDT daily chart is showing a classic breakout and retest scenario. After a prolonged downtrend marked by descending yellow trendlines, the price has finally broken out with strong bullish momentum. As you correctly observed, the asset is currently in a pullback phase, retracing toward the breakout zone to establish new support.
The Breakout Structure
The initial breakout was explosive, with the price surging from the 7.50–8.50 accumulation zone. It aggressively cleared several key moving averages (MA 5, MA 7, MA 10, MA 20, and MA 50) and pushed toward a local high near 14.00. The OBV (On-Balance Volume) indicator is trending sharply upward, confirming that smart money was accumulating during the breakout, which adds significant weight to the bullish thesis.
The Pullback and Key Support
The price is currently trading around 10.96, pulling back to test the MA 50 (10.269) and the Candle Midpoint (10.96). This is a textbook "retest of the breakout" scenario. If this zone (10.50–11.00) holds as support, it will confirm the breakout's validity and provide a solid foundation for the next leg up.
The Roadmap and Resistance
Looking ahead, the first major hurdle is the local high at 14.00. Above this, the price faces a massive resistance block (the dark red/grey shaded area) and the longer-term moving averages: MA 100 at 18.65 and MA 200 at 21.15. A successful retest here could pave the way for a rally toward these macro targets.
Key Levels to Watch
- Resistance 1 (Target): 14.00 (Previous Local High)
- Resistance 2 (Macro): 18.65 – 21.15 (MA 100 & MA 200 Zone)
- Support 1 (Retest Zone): 10.50 – 11.00 (MA 50 & Candle Midpoint)
- Support 2 (Invalidation): 8.50 (MA 5 / Structural Support)
Desk Notes:
- Warning: The pullback is healthy, but a daily close below the 10.50 support would invalidate the short-term bullish structure.
- Info: The OBV is confirming the uptrend. Watch for a bullish reversal candle (like a hammer or engulfing) in the 10.50–11.00 zone to confirm the end of the pullback.
- Action: Monitor the 10.50 level closely. A bounce here is a high-probability entry for a swing trade targeting 14.00.