

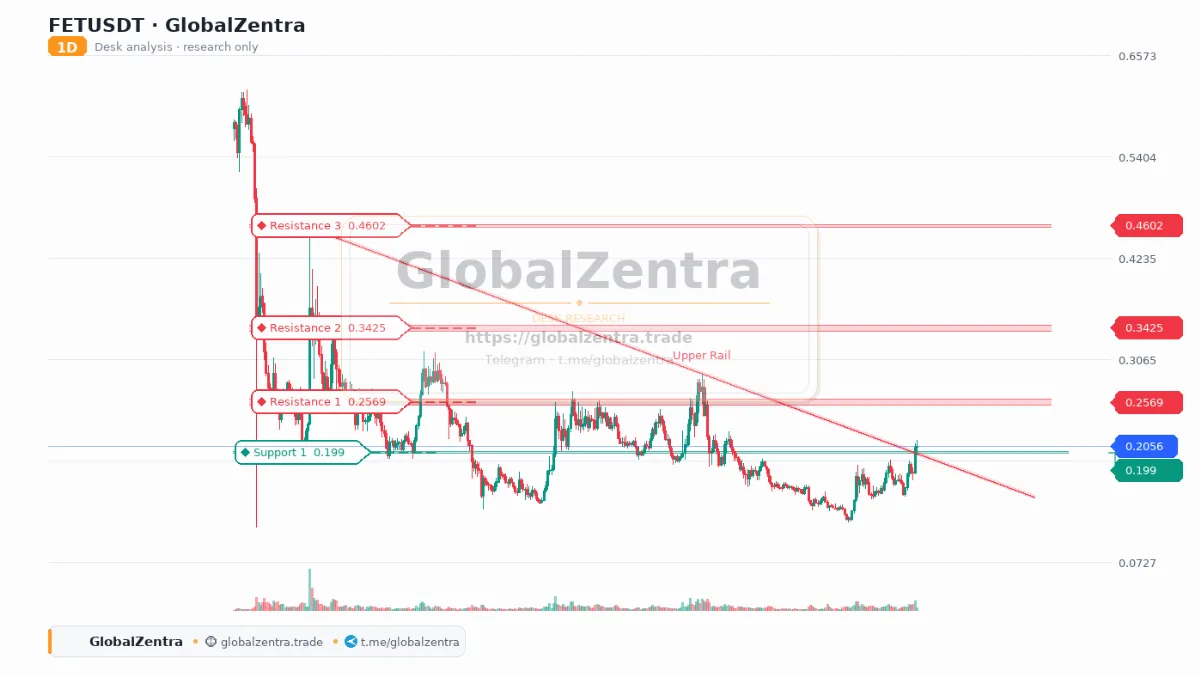
Structure
- Instrument: FETUSDT · 1d · bullish
- Pattern: Descending Triangle — Breakout above the upper rail suggests bullish continuation. Targets based on triangle height.
- Trendline descending: 0.4665 → 0.2017 (Upper Rail)
- Trendline ascending: 0.1334 → 0.2017 (Lower Rail)
- Zone resistance: 0.462768–0.470232 (Resistance 1)
- Zone resistance: 0.348787–0.354413 (Resistance 2)
- Zone resistance: 0.260896–0.265104 (Resistance 3)
- Zone support: 0.132333–0.134467 (Support 1)
- Zone support: 0.17737–0.18023 (Support 2)
- Vision notes: Descending triangle pattern with a breakout above the upper resistance. Potential for significant upside movement.
Research only
This note summarizes the source chart geometry for the GlobalZentra desk. It is not a trade ticket and does not invent ENTRY, TP, or SL levels.