

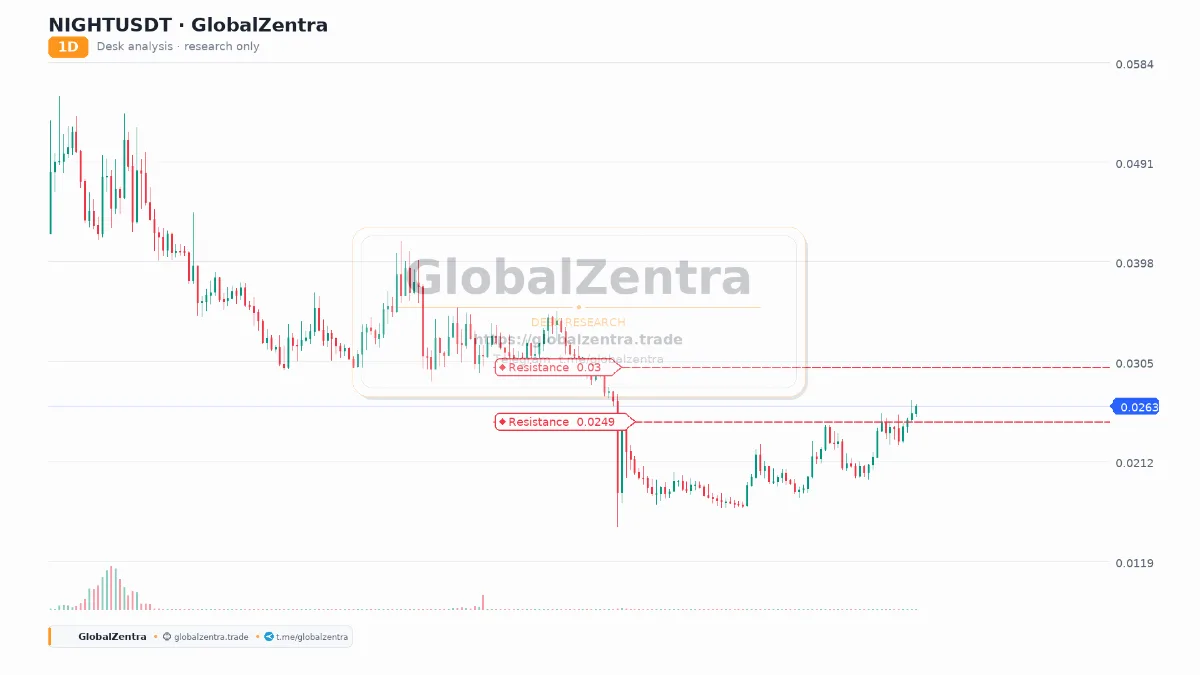
NIGHTUSDT Daily Breakout: Clearing the 0.0249 Hurdle
The NIGHTUSDT daily chart is displaying a significant technical development: the price has successfully broken above its long-standing horizontal resistance at 0.02491 (the red line). This breakout marks a potential shift in market structure, transitioning from a downtrend/accumulation phase into a bullish reversal.
The Breakout Structure
Following a massive capitulation event that drove the price down to the 0.01500 region, the asset entered a prolonged accumulation phase. The recent price action shows a steady, rounded recovery, culminating in the current breakout. The price is now trading around 0.02645, holding above the broken resistance.
The Roadmap and Next Targets
The immediate hurdle is the white horizontal line at 0.02925. If the bulls can maintain this momentum and push through this level, the path opens up toward the macro resistance at 0.04000 (the previous cycle high).
However, a healthy retest of the breakout is highly probable. The ideal scenario would be a pullback to the 0.02491 level to flip it from resistance into new support. If this retest holds, it would provide a solid foundation for a continued rally.
Key Levels to Watch
- Resistance 1 (Immediate): 0.02925 (Next Target)
- Resistance 2 (Macro): 0.04000 (Previous High)
- Support 1 (Breakout Zone): 0.02491 (Critical Retest Level)
- Support 2 (Invalidation): 0.02000 (Structural Floor)
Desk Notes:
- Warning: The breakout is confirmed, but a retest of the 0.02491 level is common after such a move. Watch for a bounce here to confirm the new support.
- Info: The volume during the breakout is a key indicator to monitor. A sustained increase in volume validates the legitimacy of the move.
- Action: Monitor the 0.02491 level closely. A successful retest and bounce here offers a high-probability entry targeting 0.02925 and beyond. A drop below 0.02000 would invalidate the bullish thesis.