

ONDOUSDT Break of Structure (BOS): A Textbook Bullish Breakout
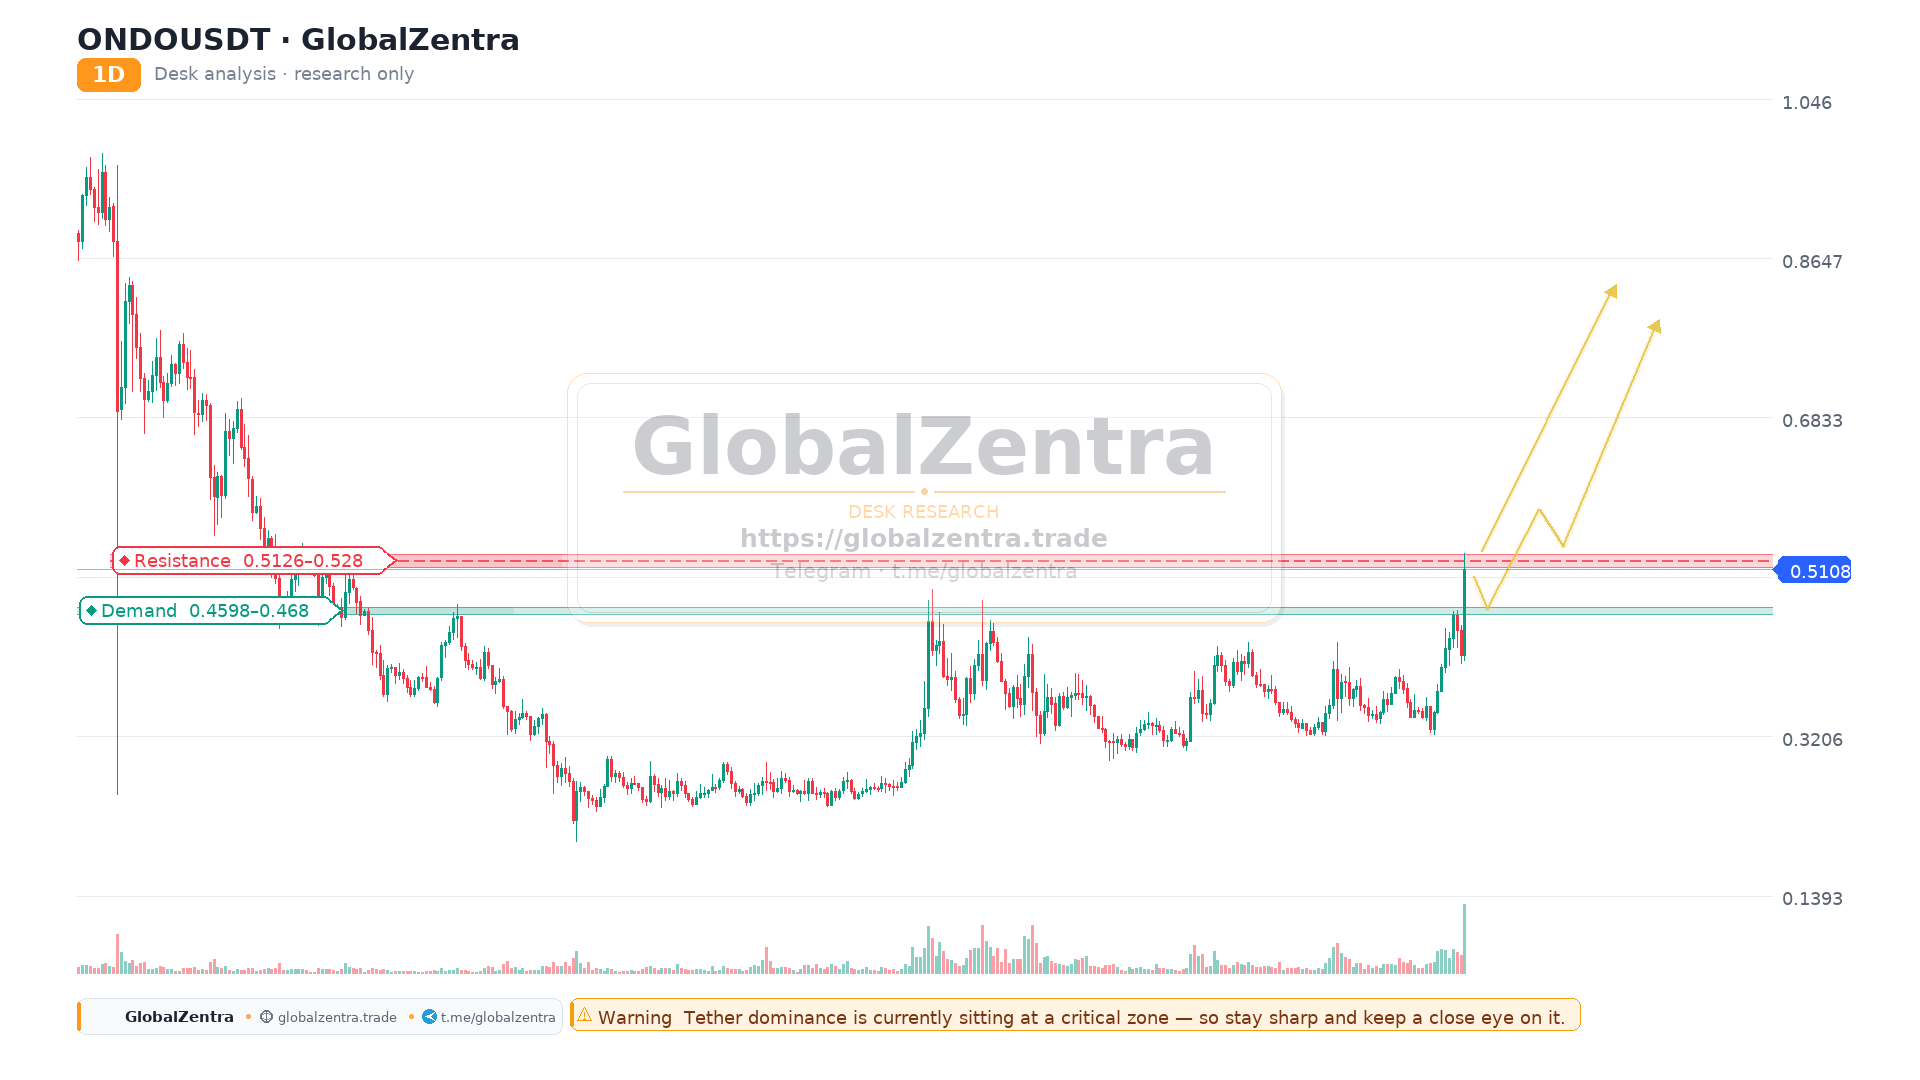
The ONDOUSDT daily chart is displaying an exceptionally strong bullish breakout with extreme precision in its technical structure. Following a prolonged accumulation phase around the 0.2500 level (marked by the "BOS" or Break of Structure label), the price has aggressively surged, breaking through multiple key resistance levels and clearing a dense cluster of moving averages.
The Breakout Structure and Moving Averages
The most prominent feature of this chart is the explosive green candle that pushed the price above the 0.4500 level and the 5-day Moving Average (MA 5 at 0.4506). The price is now trading far above the entire Moving Average fan (MA 10, 20, 50, 100, and 200). The 200-day MA rests at 0.3354, acting as a deep macro support. This separation between the price and the MAs indicates an extremely powerful upward momentum.
Indicator Confluence and Volume
The chart is equipped with multiple indicators (MACD Hist, RSI, OBV, MFI, VWMACD) which are all confirming the bullish thesis.
- The MACD is showing a strong bullish divergence with expanding histogram bars, signaling accelerating momentum.
- The RSI and MFI are trending sharply upward, confirming the influx of capital without yet showing extreme exhaustion.
- The OBV (On-Balance Volume) is rising, validating that the volume is supporting the price action.
The Roadmap and Targets
The blue arrows on the chart illustrate a classic continuation roadmap. After such a sharp vertical move, the market often needs to "breathe." The roadmap suggests a potential retest of the 0.4500–0.4800 zone (which aligns with the MA 5 and MA 10). If this zone holds as support, the next leg up will target the massive grey resistance box at 0.5500–0.6000.
Key Levels to Watch
- Resistance 1 (Target): 0.5500 (Major Macro Resistance)
- Resistance 2 (Extension): 0.6000 (Upper Boundary of the Resistance Box)
- Support 1 (Breakout Zone): 0.4500–0.4800 (Critical Retest Zone)
- Support 2 (Invalidation): 0.3354 (MA 200)
Desk Notes:
- Warning: The breakout is confirmed, but a retest of the 0.4500 zone is highly probable given the vertical nature of the move. Watch for a bounce here.
- Info: This is an RWA (Real World Asset) token showing massive relative strength. The BOS at 0.2500 confirms the trend reversal from bearish to bullish.
- Action: Monitor the 0.4500 level for a potential entry on the retest. A sustained break below this level would invalidate the short-term bullish thesis.