

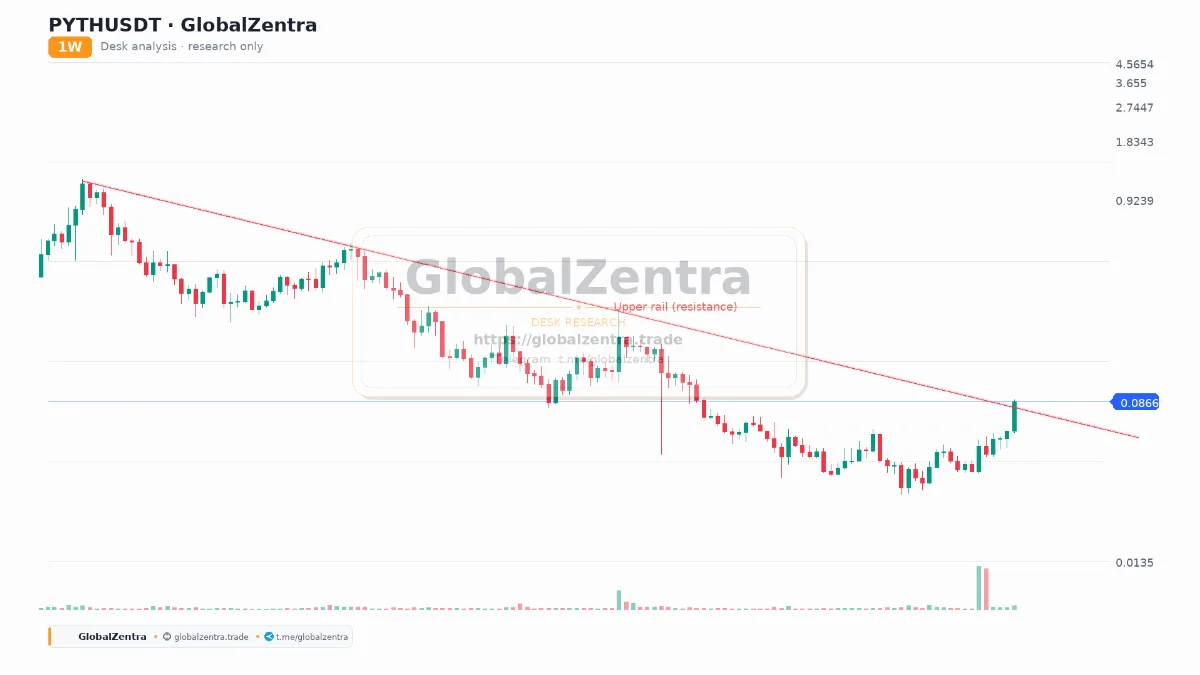
PYTHUSDT Weekly: The Final Test of the Descending Trendline
The PYTHUSDT weekly chart is displaying a highly significant technical setup. After a prolonged macro downtrend, the price has entered a massive accumulation phase at the bottom of its range. Currently trading around 0.0866, the asset is actively testing its long-term descending trendline (the red Upper Rail).
The Macro Structure and Volume
The chart highlights a classic descending resistance line that has capped the price for months. However, recent price action shows a steady, rounded recovery, culminating in the current test of this dynamic resistance. Notably, the volume profile at the bottom of the chart shows a significant spike (the large light-blue volume bar), indicating that smart money has been accumulating during this bottoming phase. This adds substantial weight to the bullish thesis.
The Breakout Scenario and Roadmap
The price is currently capped by this Upper Rail. For a macro trend reversal to be confirmed, the bulls must secure a weekly candle close above the 0.0866 – 0.0900 zone. If this occurs, the market structure shifts from bearish to bullish, and the roadmap opens up toward higher targets:
- Target 1 (Initial Resistance): 0.2000 (Previous structural high).
- Target 2 (Macro Ceiling): 0.9239 (The ultimate cycle peak).
Conversely, if the price gets rejected at this trendline (as it has in the past), it will likely remain range-bound and retest the lower support zone around 0.0500 – 0.0400.
Key Levels to Watch
- Resistance 1 (Critical): 0.0866 (Current Test / Upper Rail)
- Resistance 2 (Macro): 0.9239 (Previous Cycle High)
- Support 1 (Accumulation Base): 0.0500 (Recent Swing Low)
- Support 2 (Invalidation): 0.0400 (Macro Floor)
Desk Notes:
- Warning: The breakout is NOT confirmed until the weekly candle closes. Do not FOMO into the middle of the week. A rejection here could delay the reversal.
- Info: The volume spike is a leading indicator of a potential breakout. Watch for a strong weekly close to validate the accumulation phase.
- Action: Monitor the weekly close very closely. If it closes above 0.0866, look for a retest to enter a long position targeting 0.2000. If it rejects, wait for a return to the 0.0500 range.