

BTCUSDT 4H: The Calm Before the Range test
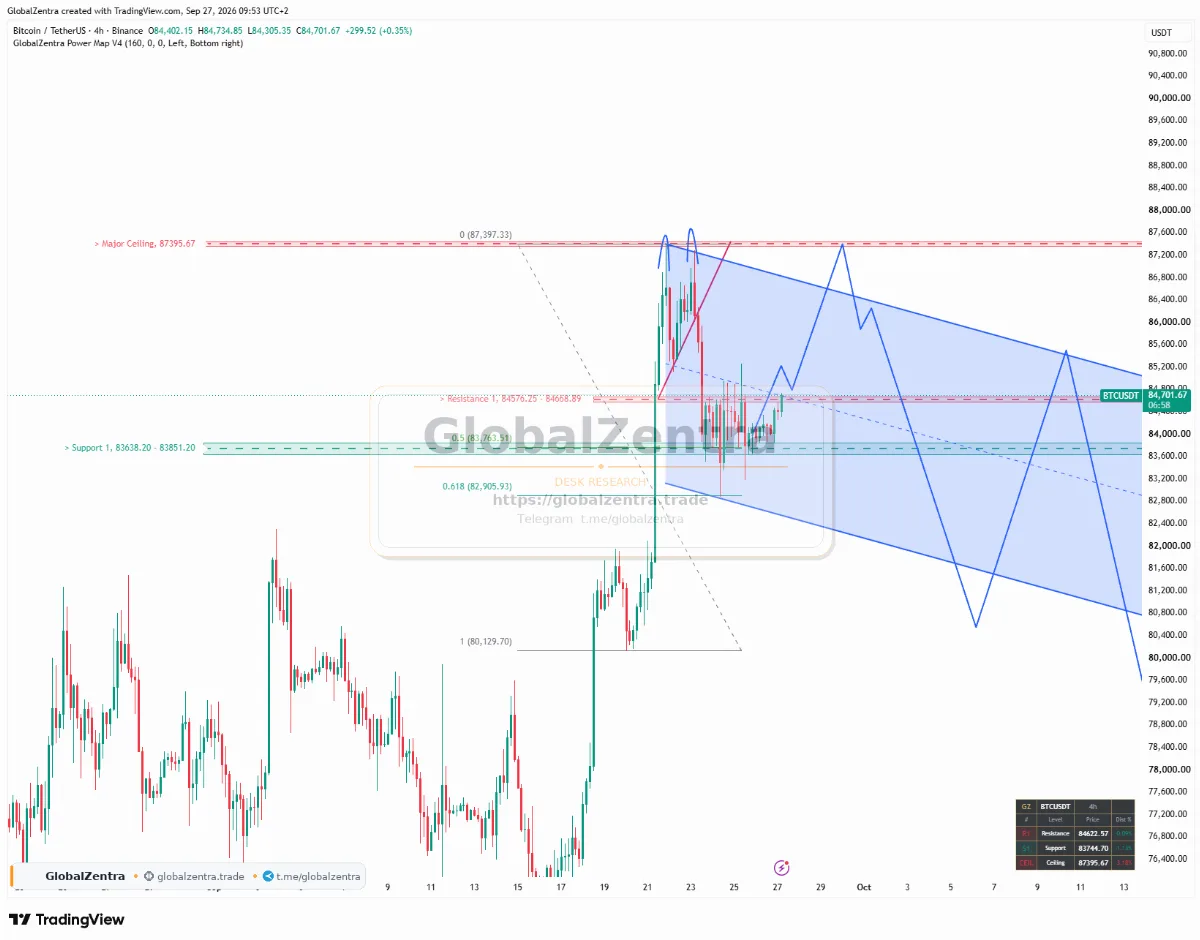
The Bitcoin (BTC/USDT) 4-hour chart is showing a classic compression phase. The price is currently squeezed between two converging rails: the red descending Upper Rail (Resistance) and the green ascending Lower Rail (Support). This structure indicates that volatility is contracting, and a significant directional move is imminent.
The Immediate Resistance and Demand Zone
The price is currently trading at 84,549.98, actively testing the immediate resistance zone at 84576.25–84668.89 (the red dashed box). It is currently capped by the descending red trendline. Buyers are attempting to pressing into, but the dynamic resistance is holding firm for now.
Below the current price, the 83638.2–83851.2 Demand Zone (the teal box) provides a strong structural floor. The ascending green lower rail is also acting as a dynamic support, pushing the price upward into the resistance.
The Roadmap and Major Ceiling
If the bulls manage to secure a decisive 4-hour close above the 84,668 resistance and the red upper rail, the path opens up toward the Major Ceiling at 87,395.67. This would confirm a bullish Range test of the compression structure.
Conversely, if the price rejects the upper rail again, it will likely slide back down to retest the 83638.2–83851.2 demand zone.
to Watch- Resistance (Immediate): 84576.25–84668.89 (Testing)
- Resistance 2 (Major Ceiling): 87,395.67 (Target)
- Support (Demand Zone): 83638.2–83851.2 (Holding)
- Support 2 (Invalidation): Below 83,638 (Would break the lower rail)
Desk Notes:
- Warning: The price is confined within the structure. Do not anticipate the Range test. Wait for a 4H candle to close above 84,668 or below 83,638 to confirm the direction.
- Info: Volume is relatively low during this compression phase, which is typical before a volatile expansion. The upper red rail remains the primary hurdle.
- Action: Monitor the interaction between the price and the 84,668 resistance. A clean break and retest of this level could offer a high-probability long setup targeting 87,395.
Market chart
Key levels
- Major Ceiling — 87395.67
- Resistance — 84576.25–84668.89
- Support — 83638.2–83851.2