Chart-backed market reads

Insights

Clear takes on Bitcoin, Ethereum and the coins moving the tape — levels, structure and context you can actually use.

17 analyses

Browse the latest chart notes, or search a ticker to jump straight to that coin.

Analysis

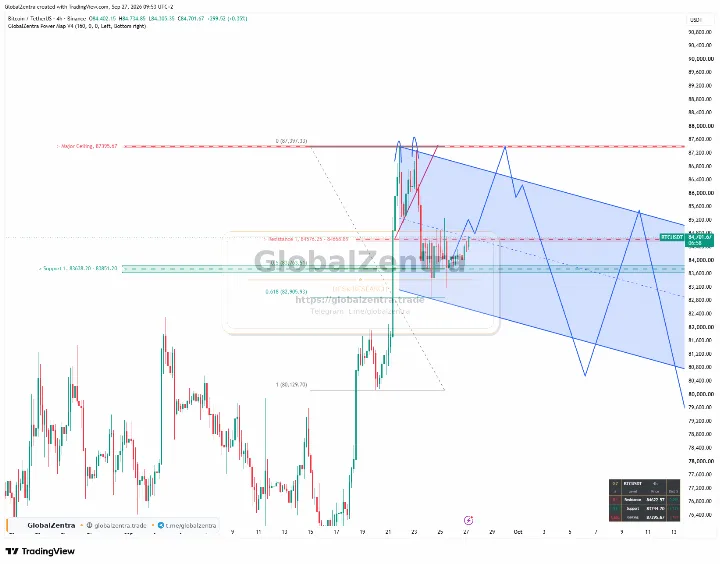
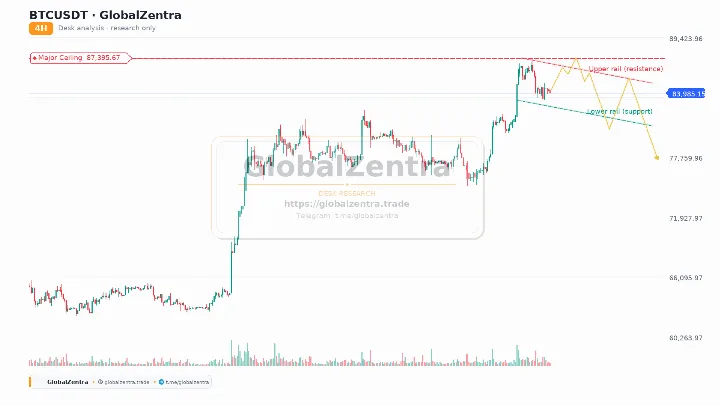
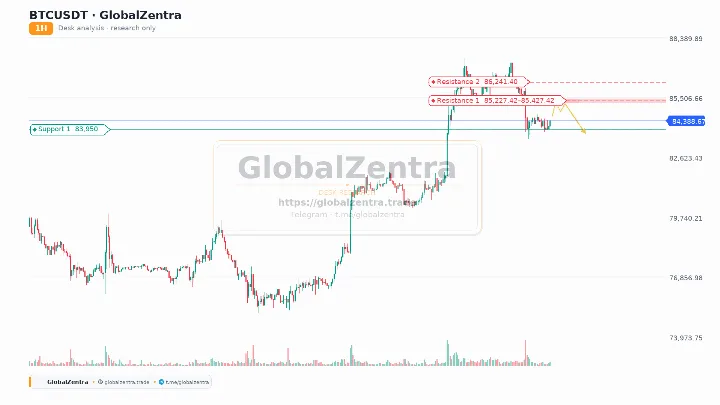
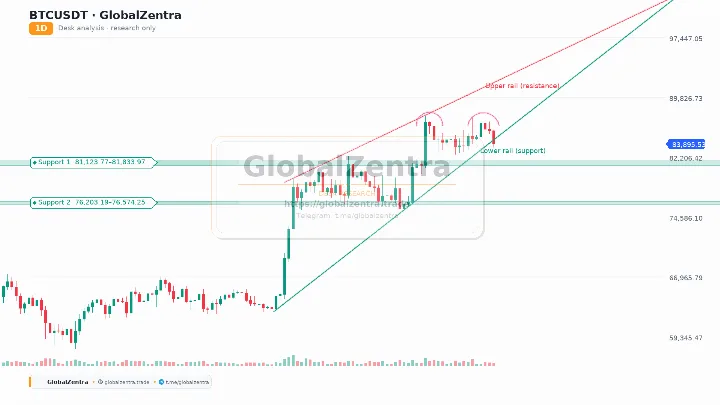
BTCUSDT Daily: Double Top Threat and the Critical $82K Neckline

Bitcoin is forming a potential Double Top pattern on the daily chart. With the neckline at $82,000–$82,500, a confirmed breakdown could target $77,500. However, the pattern remains unconfirmed until a daily close below this level.

2 min read

Analysis

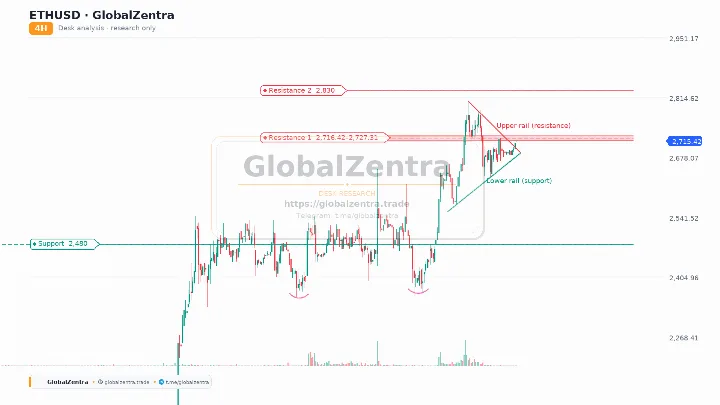
ETHUSDT 4H: Compression at Resistance, Testing the Upper Rail

Ethereum is consolidating within a tight triangle on the 4H chart, testing the 2,716–2,727 resistance zone. The price is capped by the descending upper rail. A breakout above this level is required to target the 2,830 major ceiling.

2 min read

Analysis

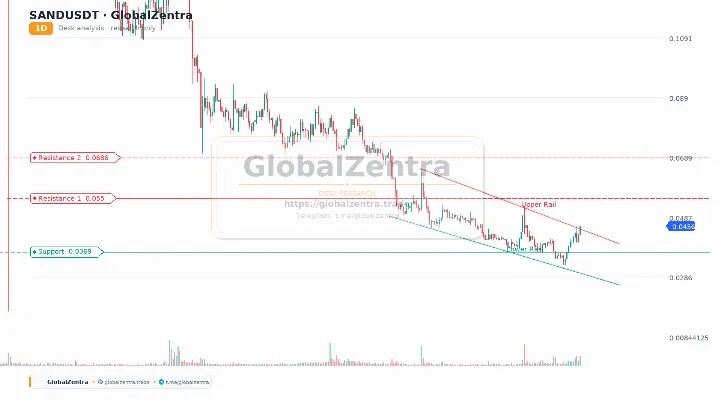
SANDUSDT Wedge Breakout: The Lagging Giant Awakens?

SAND has confirmed a breakout from a massive falling wedge on the D1 chart. As a heavily lagging altcoin, holding the 0.045 support is crucial for a run toward the 0.055 and 0.068 targets.

2 min read

Analysis

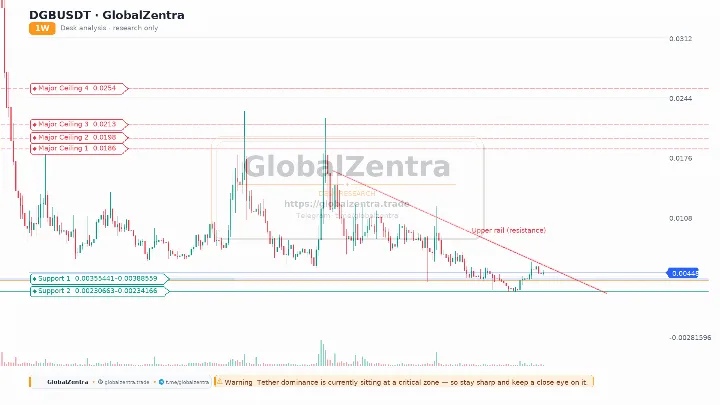
DGBUSDT Inverse H&S: Holding 0.00355 and the Bitcoin Factor

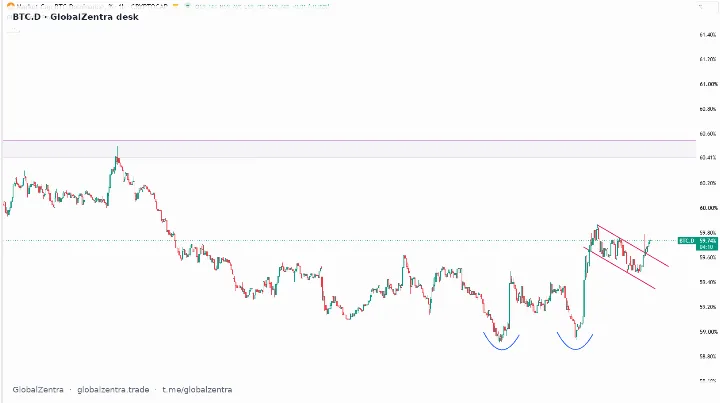
DigiByte is forming a potential Inverse Head and Shoulders pattern. A weekly hold above 0.00355 and a breakout above the yellow dynamic resistance are crucial. However, Bitcoin's sensitivity at the 86k-89k zone remains the dominant risk factor.

3 min read