

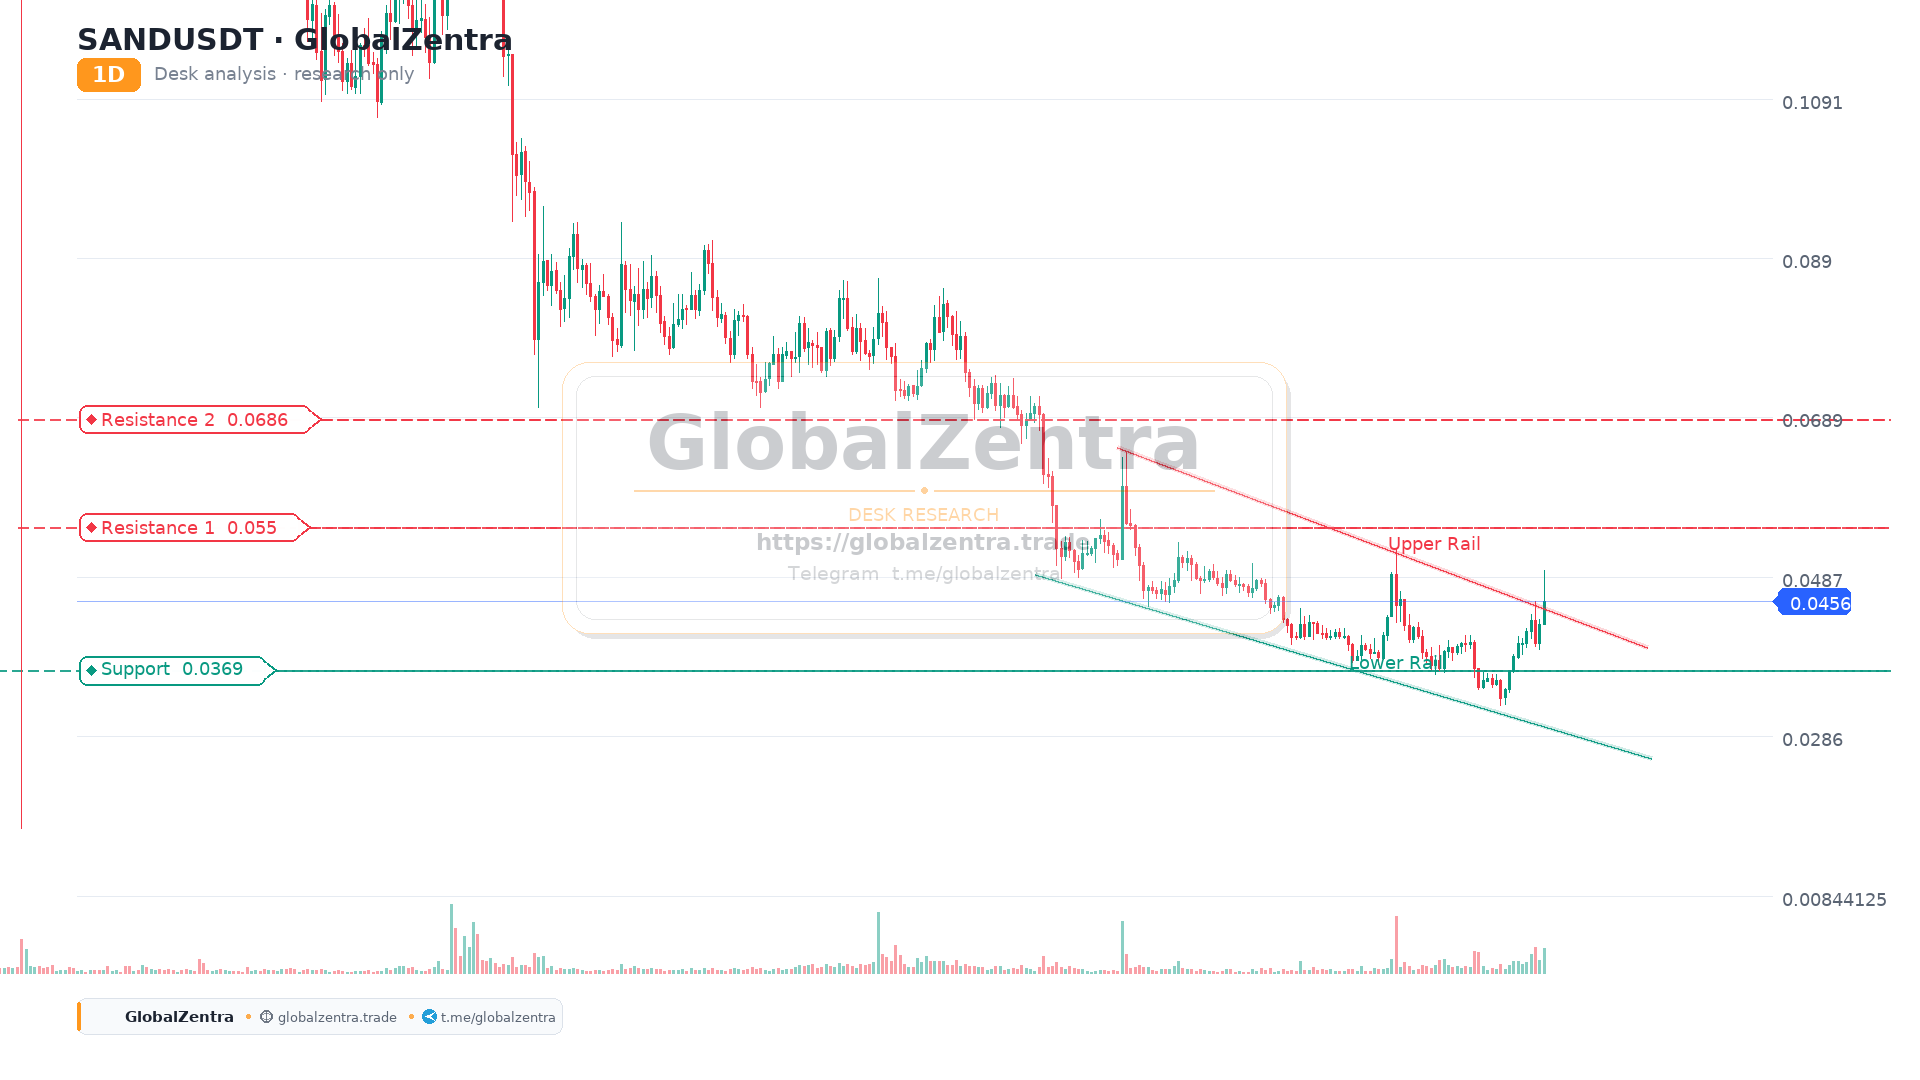
SANDUSDT Daily: Breaking the Wedge, But Playing Catch-Up
The SANDUSDT daily chart perfectly captures the "lagging altcoin" narrative you mentioned. While Bitcoin and some large caps have been consolidating or recovering, SAND was trapped in a brutal downtrend since April. However, the chart is now flashing a strong reversal signal: a falling wedge breakout.
The Wedge Breakout Structure
The falling wedge (marked by the two converging black trendlines) is a classic bullish reversal pattern. The price has finally shattered this structure, currently trading around 0.04542 with a strong +6.47% daily candle. It is currently pushing through the immediate resistance block (the red/pink zone at 0.04502–0.05000).
The Roadmap and Targets
The chart provides a clear roadmap of upside targets based on the drawn horizontal levels:
- First Target: 0.05497 (First orange line) – This is the immediate hurdle after reclaiming 0.050.
- Second Target: 0.06821 (Second orange line) – A major structural resistance.
- Macro Target: 0.08000 – 0.08381 (The massive green supply zone at the top).
Why is it Lagging? (The Bitcoin Factor)
As you rightly noted, SAND is lagging heavily. This is not a coincidence; it's a symptom of the current macro environment. Capital has been heavily concentrated in Bitcoin and stablecoins. For SAND to sustain this breakout and play "catch-up," it needs two things:
- Bitcoin Stability: BTC must hold its ground and provide a safe environment for risk-on capital to flow into altcoins.
- Tether Dominance Rejection: USDT.D must reject its current critical resistance zone. When stablecoin dominance drops, that capital typically flows into beaten-down, high-beta altcoins exactly like SAND.
Key Levels to Watch
- Resistance 1 (Immediate): 0.05000 – 0.05497 (Psychological & First Target)
- Resistance 2 (Macro): 0.06821 – 0.08381 (Major Supply Zone)
- Support 1 (Retest Zone): 0.04502 (Current breakout pivot)
- Support 2 (Invalidation): 0.03710 (Red zone / Wedge breakdown)
Desk Notes:
- Warning: The price is overextended on the daily candle. Do not FOMO at the top of this green candle. A retest of the 0.0450 zone is highly likely.
- Info: The wedge breakout is confirmed, but the trend reversal is only validated if the price holds above the red/pink resistance block (0.04502) and turns it into support.
- Action: Monitor the 0.0450–0.0460 zone for a potential entry on the retest. If BTC stabilizes, SAND is a prime candidate for a violent short-squeeze/catch-up rally toward the 0.055 level.