

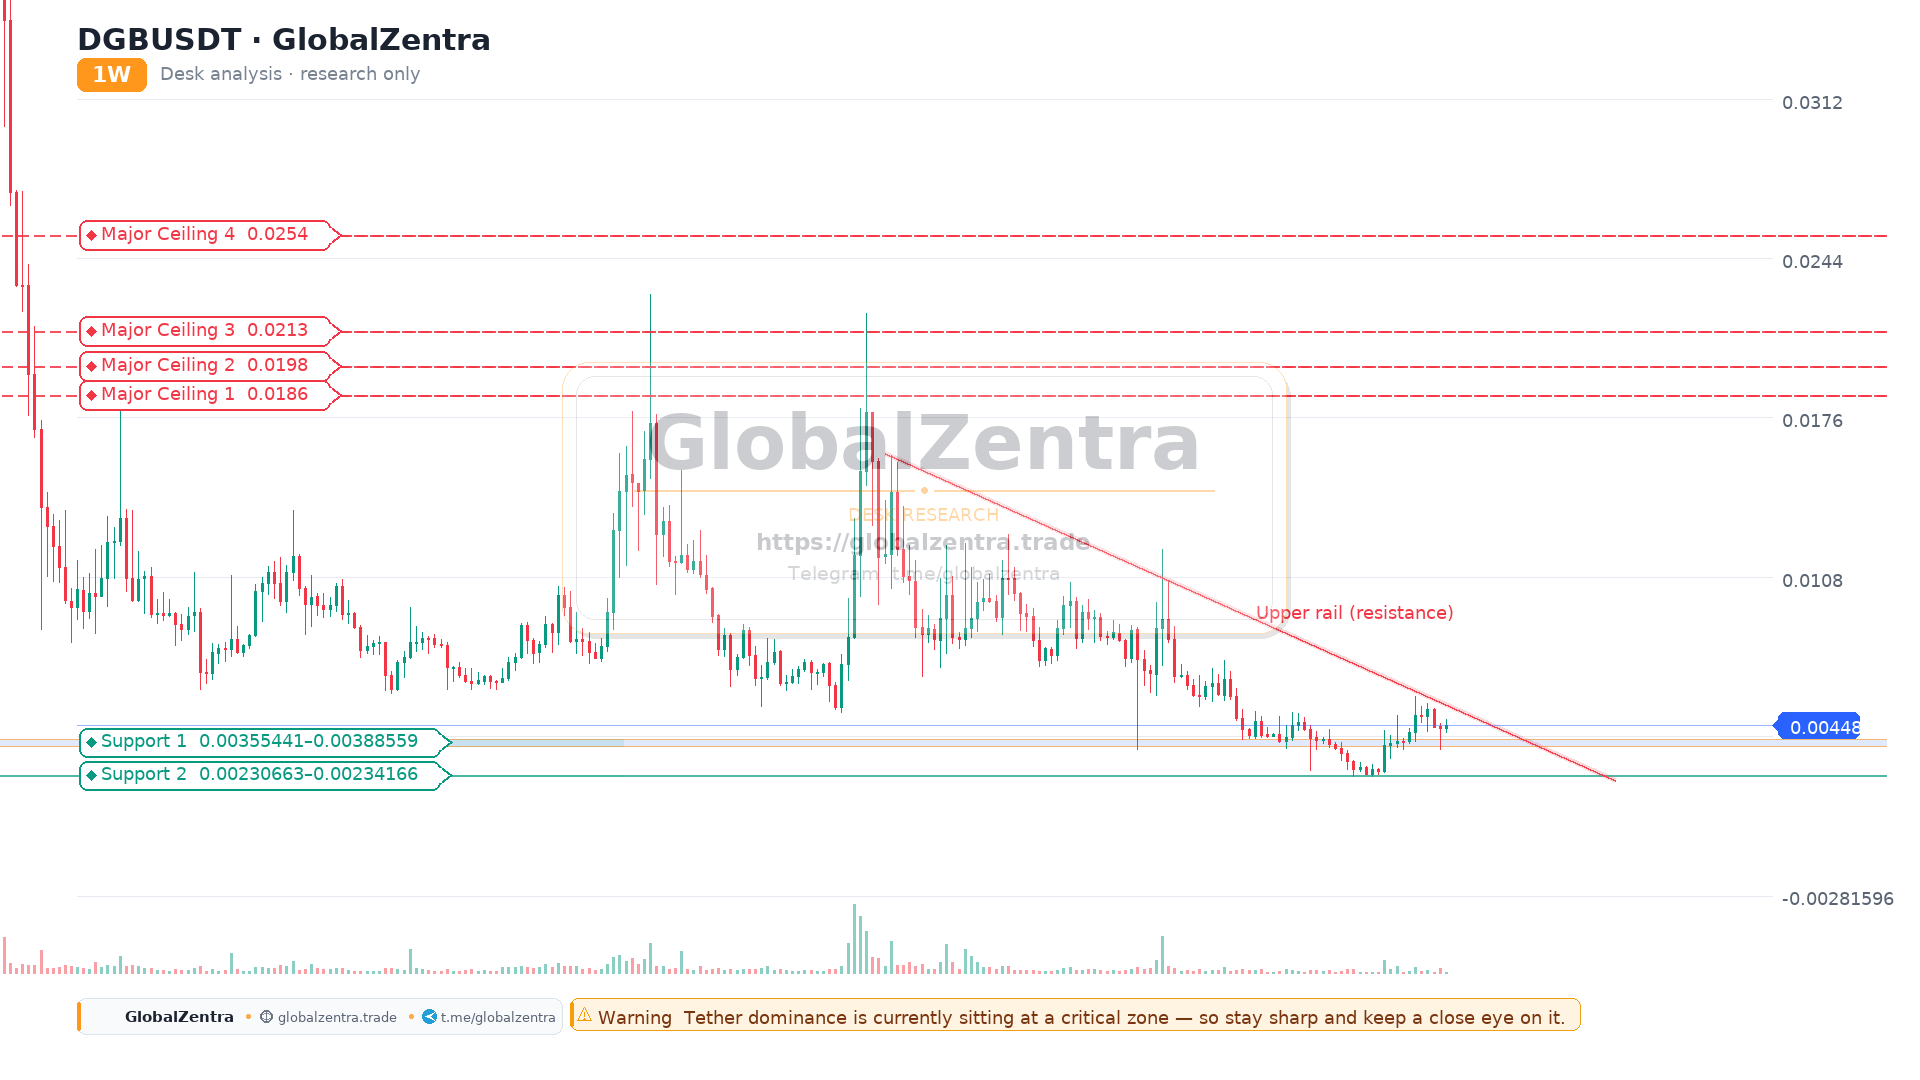
DGBUSDT: The Make-or-Break Moment at 0.00355
The DGBUSDT daily chart is showing early signs of a potential trend reversal, but the setup is currently on a knife's edge. The price is attempting to carve out a bottom, forming what appears to be a triple bottom or an Inverse Head and Shoulders (IH&S) pattern. However, as you astutely observed, the asset lacks the strong momentum needed to confirm this structure, largely because Bitcoin is holding its breath at a critical macro junction.
The Pattern and Key Levels
The red curves on the chart highlight the potential IH&S formation. For this pattern to be validated and to trigger a move toward higher targets, two conditions must be met:
- The Weekly Hold: The price must successfully hold the 0.00355 horizontal support (which acts as the neckline of the pattern) on a weekly closing basis. Losing this level would invalidate the bullish thesis and likely lead to a retest of the 0.00205 lows.
- The Dynamic Breakout: The price needs to break and close above the yellow dashed trendline (the dynamic resistance of the descending channel). Currently trading around 0.00446, the price is approaching this trendline but has not yet confirmed a breakout.
The Bitcoin Dominance Factor
This is where the macro picture comes into play. Bitcoin is currently at a highly sensitive zone (86k-89k). A true trend reversal for the broader market requires BTC to establish a firm footing and close above this range for several consecutive weeks.
Until BTC provides this stability, altcoins like DGB will struggle to sustain upward momentum. As you rightly noted, if Bitcoin fails to hold its ground, the entire crypto market could experience sharp corrections, dealing a heavy blow to traders who positioned themselves too early.
The Roadmap Ahead
If DGB holds 0.00355 and BTC stabilizes, a breakout above the yellow trendline could open the door for a rally toward the 0.01243 level, and eventually the major resistance at 0.01621. Conversely, a breakdown below 0.00355, exacerbated by a BTC drop, would invalidate the pattern and extend the downtrend.
Key Levels to Watch
- Resistance 1 (Target): 0.01243 (Previous Local High)
- Resistance 2 (Macro): 0.01621 (Major Swing High)
- Support 1 (Neckline): 0.00355 (Critical Weekly Hold)
- Support 2 (Invalidation): 0.00205 (Recent Swing Low)
Desk Notes:
- Warning: The pattern is not confirmed. Do not front-run the breakout. Wait for a weekly close above 0.00355 and a daily close above the yellow trendline. A BTC drop is the biggest risk to this setup.
- Info: The market is currently in a "wait-and-see" mode. Altcoin strength is entirely dependent on Bitcoin's ability to hold the 86k-89k zone.
- Action: Monitor BTC's price action at the 86k-89k resistance. If BTC rejects, expect DGB to retest its lower supports. If BTC breaks out, DGB is a prime candidate for a high-beta rally.