

Bitcoin's Liquidity Trap: A Fake Breakout Before the Drop?
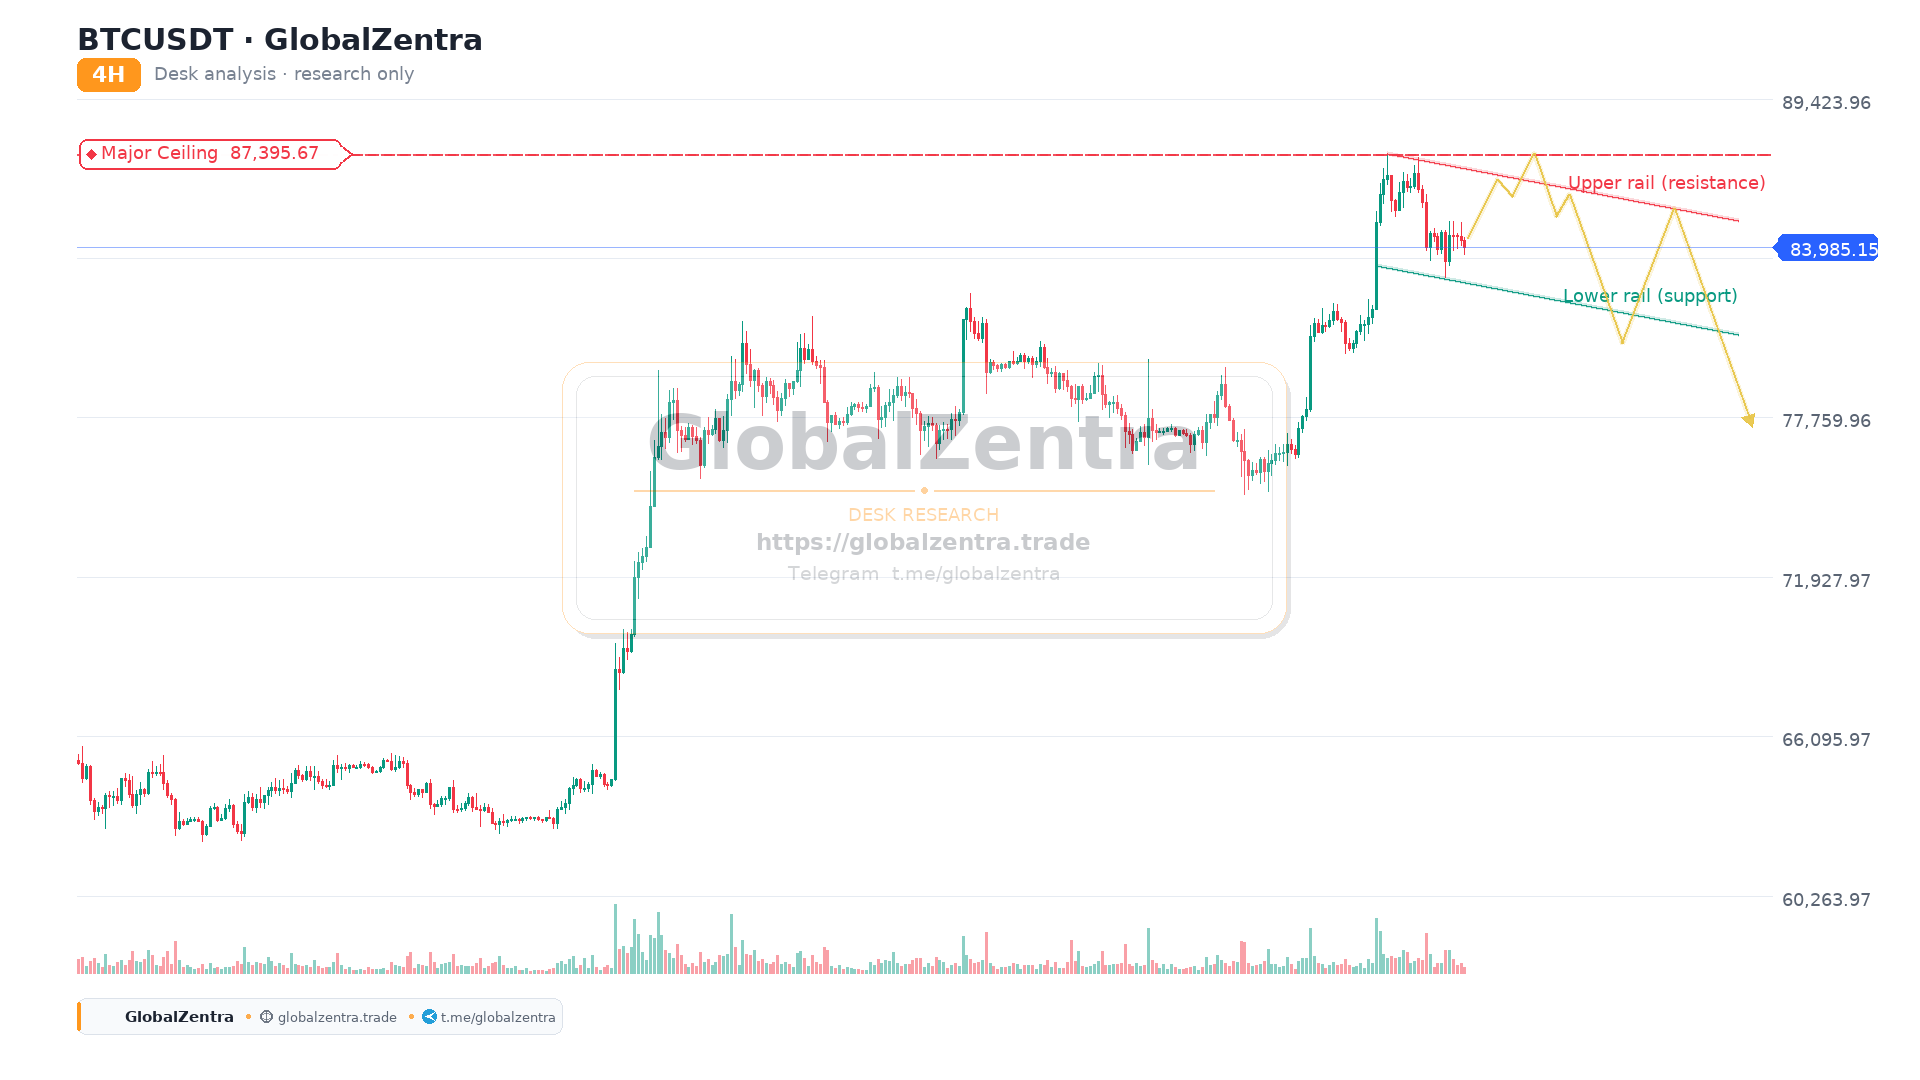
The Bitcoin (BTC/USDT) hourly chart is setting up a classic liquidity trap. As you correctly pointed out, the price is currently grinding upward within an ascending channel (the blue shaded area), approaching a critical confluence of resistance. The roadmap drawn on the chart (blue arrows) perfectly illustrates a fake breakout and stop hunt scenario.
The Stop Hunt and Fake Breakout Thesis
Above the current price action, there is a dense cluster of liquidity. The descending red trendline and the upper boundary of the blue channel converge around the $85,000–$86,000 zone. Furthermore, the recent swing high at $87,397 serves as a massive magnet for price.
In this scenario, market makers often push the price above these obvious resistance levels to trigger stop-losses of short sellers and trap breakout traders (FOMO buyers). This is the "Stop Hunt." Once the liquidity is swept, the price is violently rejected, leaving a "fake breakout" (or bull trap) on the chart, and then reversing sharply.
Fibonacci and Support Levels
The Fibonacci retracement tool highlights the current battleground:
- The 0.5 level at $83,763 is the immediate pivot. The price is currently hovering right around this level.
- The 0.618 level at $82,905 is the next critical support. If the fake breakout scenario plays out, this level might be tested quickly.
- The major structural support lies at the 1.0 level ($80,129).
The Roadmap to $75K
If the blue arrows on the chart play out, the sequence will be:
- The Grind Up: Price pushes toward $85K–$86K.
- The Fakeout: A sudden wick above the red trendline to sweep liquidity.
- The Rejection: Price fails to hold the breakout and drops below the channel.
- The Dump: A sharp correction targeting the major horizontal support at $75,173.
Key Levels to Watch
- Resistance 1 (Liquidity Zone): $85,000 – $86,000 (Channel Top & Red Trendline)
- Resistance 2 (Major Swing High): $87,397 (The ultimate stop hunt target)
- Support 1 (Immediate): $83,763 (0.5 Fib)
- Support 2 (Major Target): $75,173 (Bottom of the range / Dump target)
Desk Notes:
- Warning: Do not FOMO into longs near the channel top. The risk-to-reward ratio heavily favors a short setup if a fake breakout occurs.
- Info: Watch for bearish divergence on the RSI or MACD as the price approaches $86K. This would confirm the exhaustion before the drop.
- Action: Wait for the fake breakout. Look for a strong bearish engulfing candle or a long upper wick above the channel to confirm the stop hunt, then target the $80,129 and $75,173 levels.