

PHAUSDT Breakout Analysis: Retest and Bullish Continuation
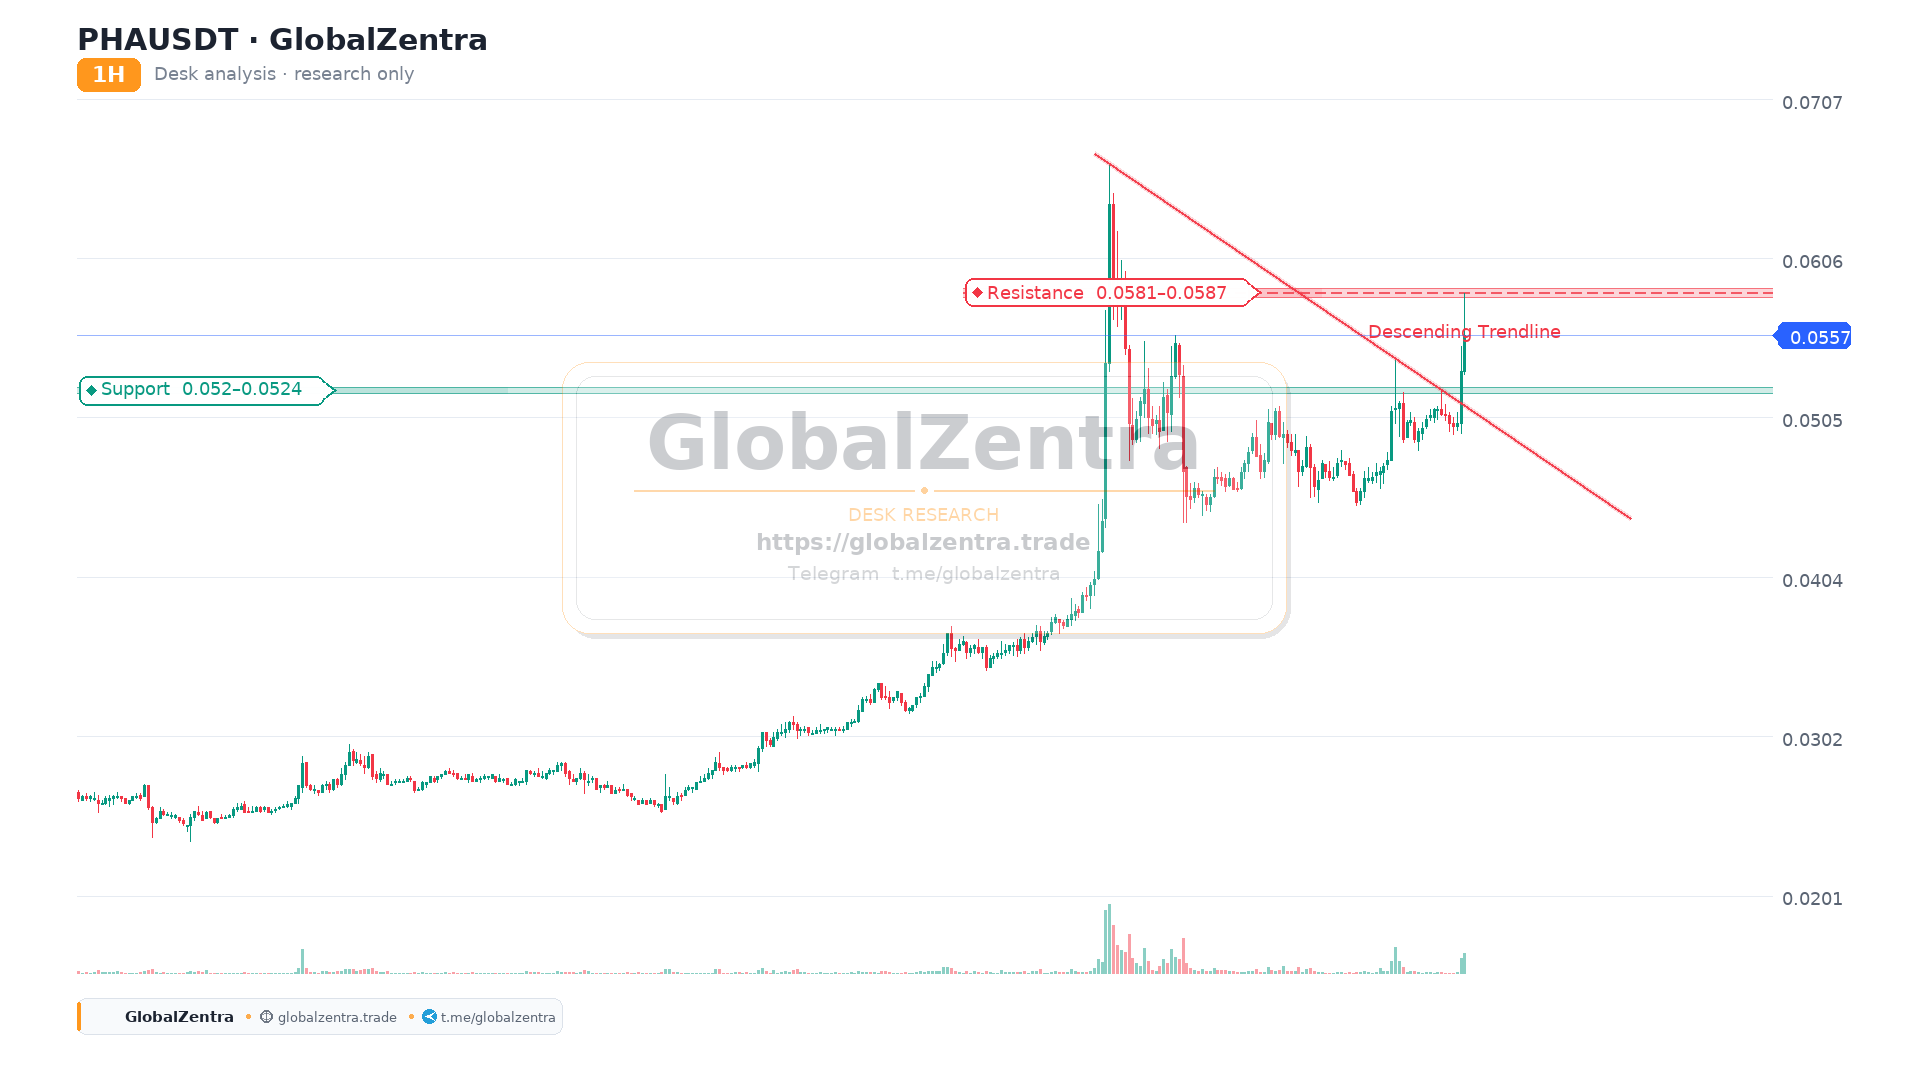
The PHAUSDT daily chart is displaying a textbook bullish breakout followed by an impending pullback. After a prolonged downtrend marked by the dashed yellow trendline, the price has finally shattered this resistance, surging aggressively to the upside. The asset is currently trading around 0.0563, and all signs point to a healthy retest before the trend continues.
The Breakout and Moving Averages
The breakout is validated by the fact that the price is now trading comfortably above all major moving averages. We can see a perfect bullish fan forming: MA 5 (0.0520), MA 7 (0.0516), MA 10 (0.0514), MA 20 (0.0508), MA 50 (0.0488), and MA 100 (0.0487) are all clustered below the current price. This alignment confirms a strong shift in market structure from bearish to bullish.
The Pullback Thesis
The primary reason to expect a pullback is the Bollinger Band positioning. The price (0.0563) is currently trading above the Upper Bollinger Band (0.0539) and significantly above the Candle Midpoint (0.0549). In technical analysis, this often signals short-term overextension. A mean reversion (pullback) is highly probable to cool off the indicators.
The ideal retest zone lies between 0.0520 and 0.0540. This area aligns with the 5-day Moving Average, the Candle Midpoint, and the previous breakout point of the trendline.
The Roadmap and Targets
If this retest zone holds as support, it will provide a solid foundation for the next leg up. The immediate targets are the previous local highs at 0.0600 and then 0.0650. Conversely, if the price loses the MA 20 support at 0.0508, the bullish thesis would be invalidated, and a deeper correction toward MA 50 at 0.0488 could follow.
Key Levels to Watch
- Resistance 1 (Target): 0.0600 (Previous Local High)
- Resistance 2 (Macro): 0.0650 (Major Swing High)
- Support 1 (Retest Zone): 0.0520 – 0.0540 (MA 5 & Candle Midpoint)
- Support 2 (Invalidation): 0.0508 (MA 20 / BB Basis)
Desk Notes:
- Warning: The price is overextended above the Bollinger Bands. Do not chase the green candle; wait for the pullback.
- Info: The trendline break is confirmed. The pullback is a healthy market mechanism to establish new support.
- Action: Monitor the 0.0520–0.0540 zone for a potential entry. Look for a bullish reversal candle (like a hammer or engulfing) in this zone to confirm the end of the pullback.