

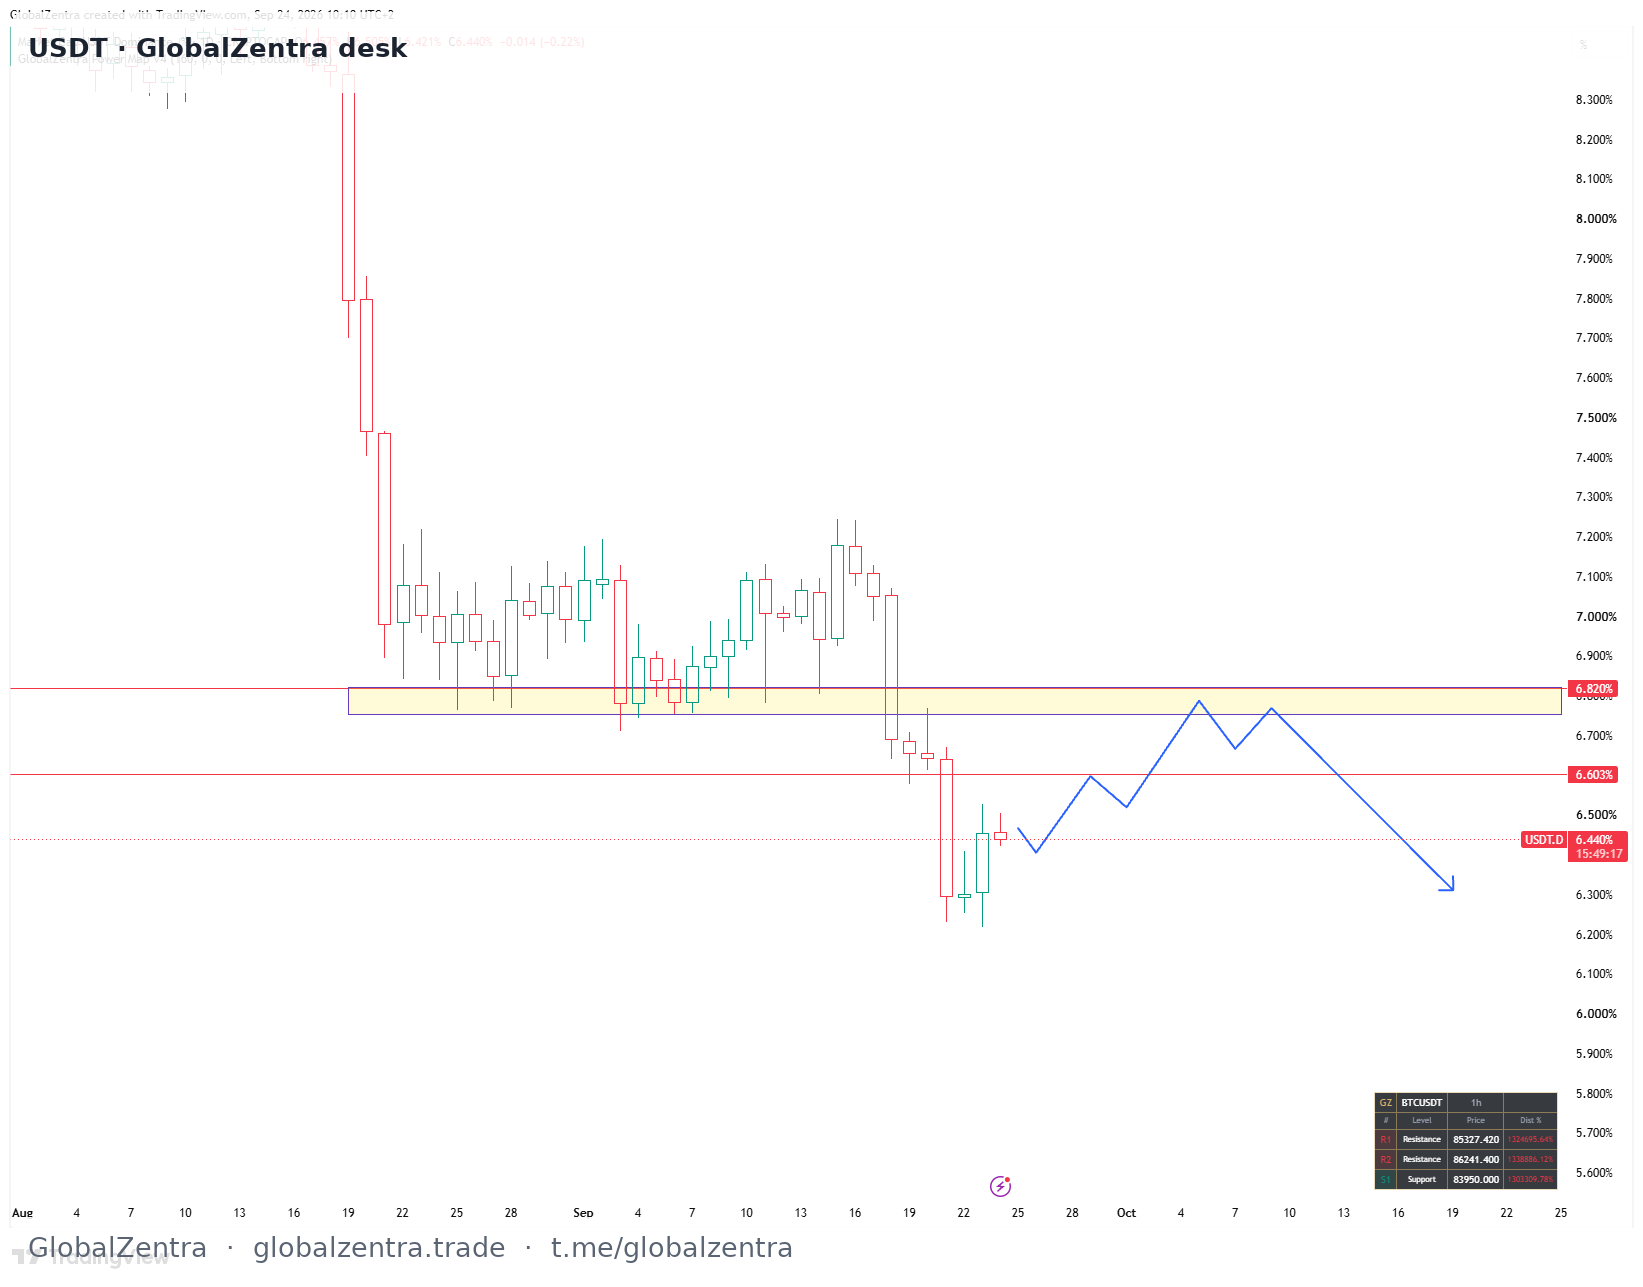
Tether Dominance: A Potential Retest of 6.80% Before Monthly Close
Tether Dominance (USDT.D) is currently trading around 6.43% on the daily timeframe, showing signs of a short-term recovery after a significant drop from the 8.00% region. The chart reveals a sharp decline followed by a consolidation phase, where the price is now attempting to push back up toward the 6.80% resistance level.
The Monthly Close Recovery and Retest Scenario
As we approach the monthly close, there is a growing possibility of a recovery in Tether Dominance. The current price action suggests that USDT.D is aiming to retest the 6.80% zone. However, the critical question is whether it can break through this resistance or if it will face a rejection. If the price touches this zone and gets rejected, it would confirm a "monthly close bounce" for Tether, which could be the final push before a continuation of its downtrend.
The Inverse Correlation with Bitcoin
It is crucial to remember that Tether Dominance and Bitcoin typically move in inverse correlation. When USDT.D rises (even temporarily), it usually indicates that capital is moving into stablecoins (risk-off sentiment), which puts downward pressure on Bitcoin and altcoins. Therefore, a retest and rejection at the 6.80% level for USDT.D could provide the necessary fuel for Bitcoin to resume its upward momentum.
Desk Notes:
- Warning: The recovery is not confirmed. A daily close above 6.80% is needed to validate the bullish case for USDT.D; otherwise, a rejection is likely.
- Info: Inverse correlation with BTC remains the primary driver. A rejection at 6.80% could cap Bitcoin's downside and trigger a rally.
- Action: Monitor the 6.80% level closely. A touch and rejection here would likely signal a continuation of the downtrend for Tether and a potential rally for Bitcoin.
Market chart
Key levels
- 6.82% — 6.82
- 6.46% — 6.46
- 6.82% — 6.82
- 6.46% — 6.46