

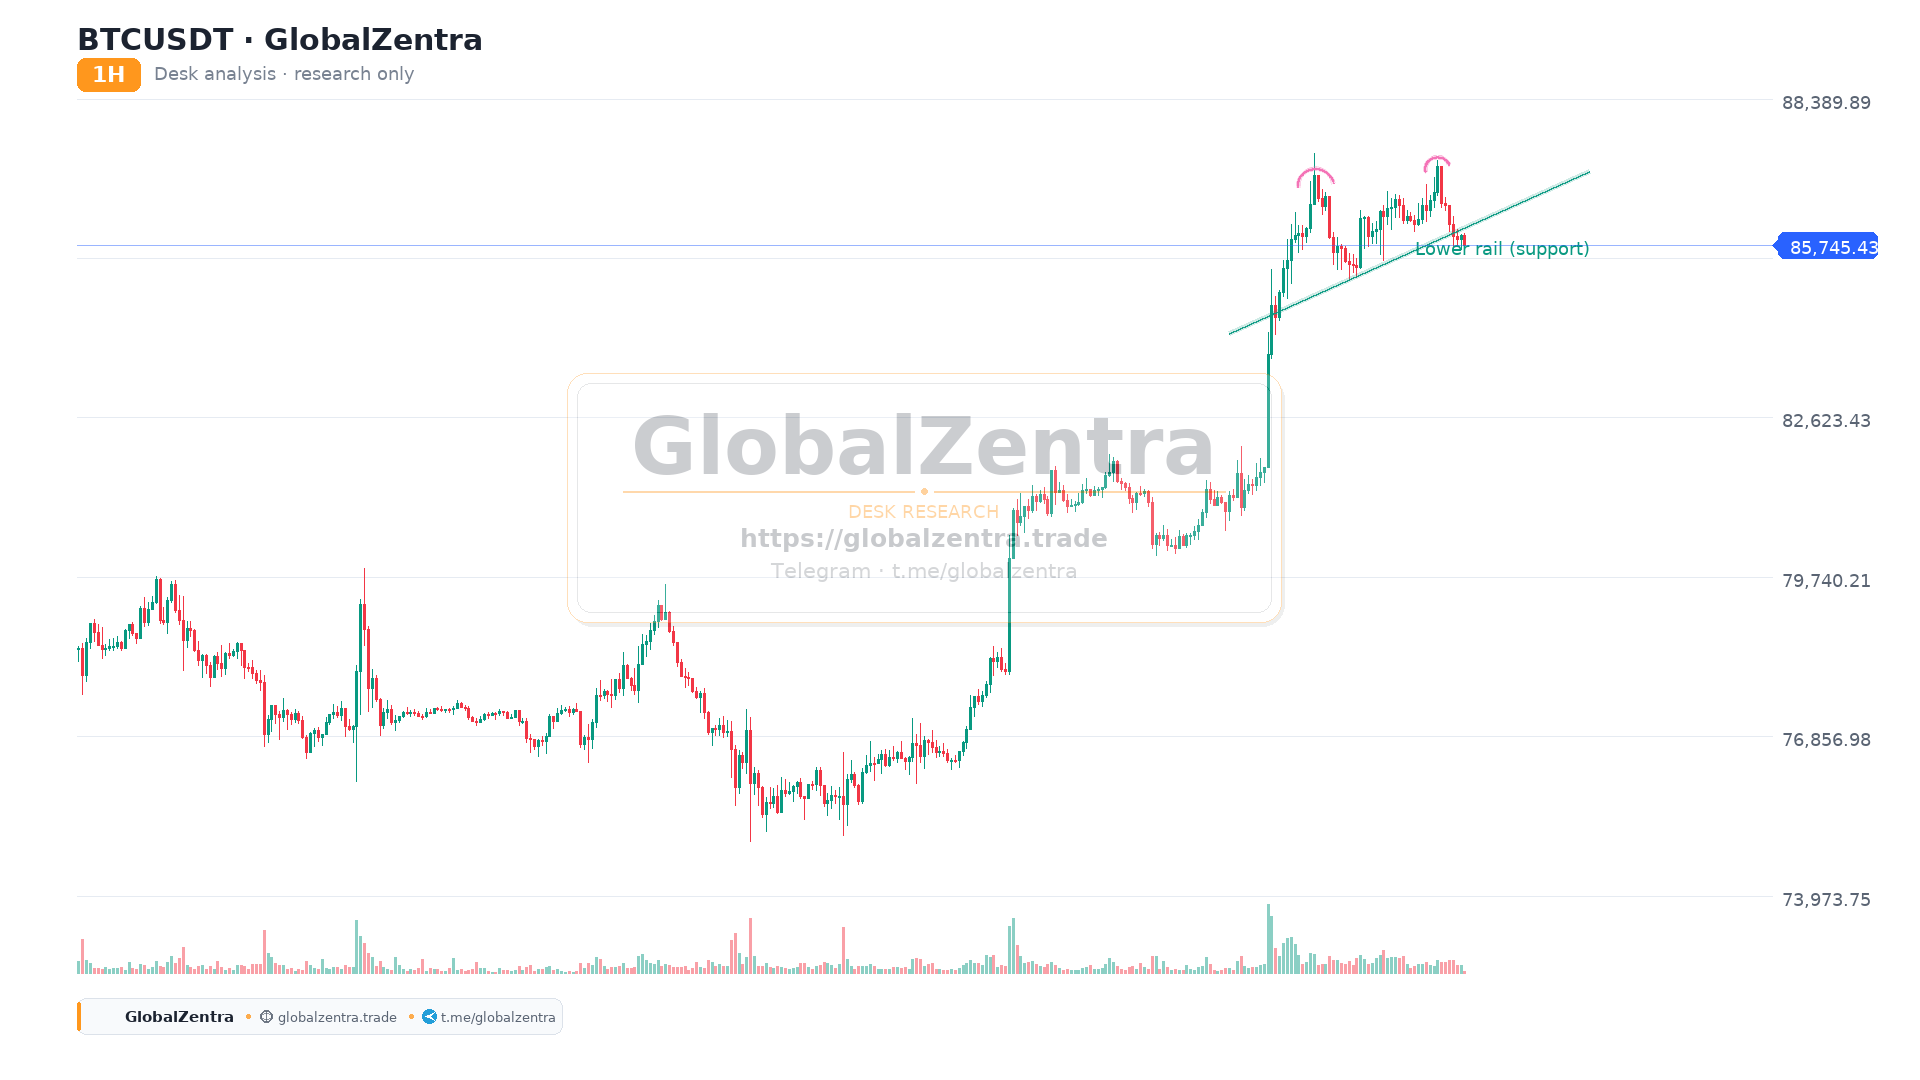
At the desk close, BTCUSDT is printing around 85,847.69 on the 1-hour timeframe. Contrary to a bullish channel narrative, the chart is actually flashing clear warning signs of a trend reversal. Here is the accurate structural breakdown:
1. Double Top Formation
The chart clearly shows a Double Top pattern at the recent highs. Price formed two distinct peaks with a slight trough in between, signaling that buyers failed to push through to new highs. This is a classic bearish reversal pattern, indicating that momentum is shifting from bulls to bears.
2. Trendline Breakdown
The rising trendline (previously acting as dynamic support) has been broken to the downside. Price is currently trading below this broken line. This breakdown confirms that the prior uptrend has lost its structural integrity, and the market is now transitioning into a corrective or bearish phase.
3. Price Action & Key Levels
Resistance: The 86,200 zone (the neckline of the Double Top) and the broken trendline now act as overhead resistance. A failed retest of this zone would confirm the bearish bias.
Support: Immediate support sits at the 85,745 level. If this gives way, the next major demand zone is around 82,500, which would complete the measured move of the Double Top pattern.
Desk Notes
Pattern: Double Top – Bearish Reversal
Structure: Trendline broken – momentum shifting bearish
Watch For: A confirmed close below 85,745 to validate further downside toward 82,500.
- Bottom Line: The bullish structure has been compromised. Unless price can reclaim the broken trendline and break back above 86,200 with conviction, the path of least resistance is now to the downside.