

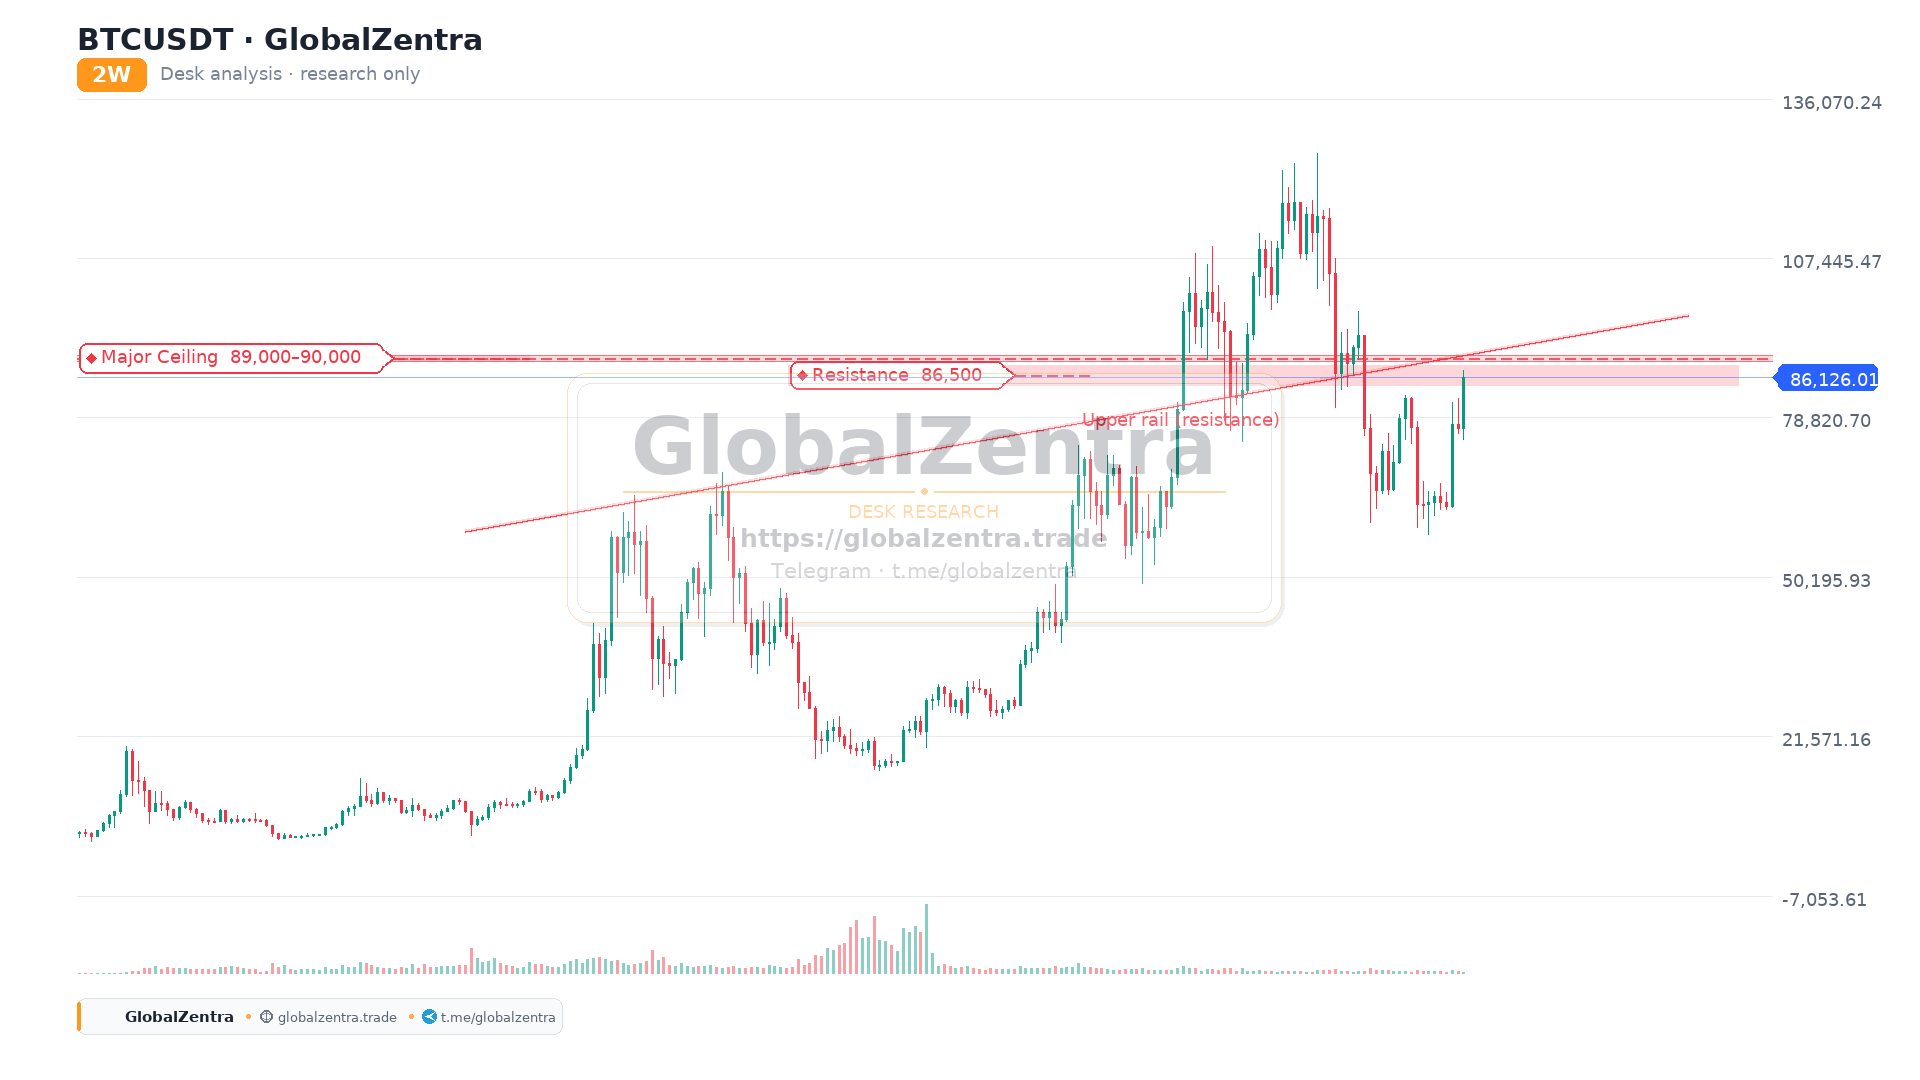
Bitcoin Price Action: 2-Week Chart Analysis
Bitcoin is currently trading around the $86,500 level on the 2-week chart, with the $89,000–$90,000 zone remaining a key resistance area.
If today’s daily candle manages to close above $86,500 while forming a doji, it could keep the door open for another test of the higher resistance zone at $89,000–$90,000 before the monthly close.
The daily candle close is therefore an important level to watch. How price closes above or below $86,500 could provide useful confirmation for the next move.
Desk Notes:
- Warning: Watch today’s daily candle close around $86,500.
- Info: $89,000–$90,000 remains the key resistance zone.
- Tip: A daily doji close above $86,500 would be worth watching closely for confirmation.